
Regulatory Oversight Report for Uranium and Nuclear Substance Processing Facilities in Canada: 2021
Table of contents
- 1 Overview
- Overview
- 3 Uranium Processing Facilitie
- 4 Nuclear Substance Processing Facilities
- 5 CNSC Regulatory Oversight
- 6 The CNSC’s Assessment of Safety at Uranium and Nuclear Substance Processing Facilities
- 6.1 Management System
- 6.2 Human Performance Management
- 6.3 Operating Performance
- 6.4 Safety Analysis
- 6.5 Physical Design
- 6.6 Fitness for Service
- 6.7 Radiation Protection
- 6.8 Conventional Health and Safety
- 6.9 Environmental Protection
- 6.10 Emergency Management and Fire Protection
- 6.11 Waste Management
- 6.12 Security
- 6.13 Safeguards and Non-Proliferation
- 6.14 Packaging and Transport
- 7 Indigenous Consultation and Engagement
- 8 Events and Other Matters of Regulatory Interest
- 9 Overall Conclusions
- 10 References
- 11 Acronyms and Abbreviations
- 12 Glossary
- A. Links to Licensee Websites and Annual Compliance Reports
- B. CNSC Inspections
- C. Significant Changes to Licences and Licence Conditions Handbooks
- D. Regulatory Document Implementation
- E. Financial Guarantees
- F. Safety and Control Area Ratings
- G. Total Annual Releases of Radionuclides Directly to the Environment
- H. Public Dose Data
- I. Environmental Data
- J. Worker Dose Data
- K. Health and Safety Data
- L. Reportable Events
- M. Indigenous Nations, Communities and Organizations whose Traditional and/or Treaty Territories are in Proximity to Uranium and Nuclear Substance Processing Facilities Covered in the 2021 ROR
- N. Participant Funding Recipients for the 2021 UNSPF Regulatory Oversight Report
1.1 Changes to 2021 regulatory oversight report
As with other regulatory oversight reports produced by the Canadian Nuclear Safety Commission (CNSC), changes have been made to this report as a result of recommendations/direction from the Commission and feedback from intervenors. CNSC staff made the following changes to the Regulatory Oversight Report for Uranium and Nuclear Substance Processing Facilities in Canada: 2021:
- Land acknowledgements have been added in the facility description sections.
- Indigenous consultation and engagement has been made a stand-alone section.
- Collaborative reporting on long-term engagement activities with Indigenous Nations and communities has been provided.
- Summaries of the urine analysis results on the concentration of uranium in the urine of nuclear energy workers have been included.
Plain language summary
The Regulatory Oversight Report for Uranium and Nuclear Substance Processing Facilities in Canada: 2021 provides information on the safety performance of these types of nuclear facilities. The report is based on Canadian Nuclear Safety Commission (CNSC) staff’s work to ensure the health, safety and protection of the people and the environment around licenced uranium and nuclear substance processing facilities (UNSPFs). In 2021, all facilities operated safely. Monitoring data showed that the water and food grown nearby were safe for consumption. There were no releases from UNSPFs that could have harmed human health or the environment.
This report also provides an update on CNSC staff’s regulatory activities pertaining to public information, community engagement, and aspects of the CNSC’s Independent Environmental Monitoring Program that relate to UNSPFs. Where possible, trends are shown and information is compared to previous years.
This report provides information on the following licensed facilities in Canada:
- Uranium processing facilities
- Cameco Corporation Blind River Refinery, Blind River, Ontario
- Cameco Corporation Port Hope Conversion Facility, Port Hope, Ontario
- Cameco Fuel Manufacturing Inc., Port Hope, Ontario
- BWXT Nuclear Energy Canada Inc., Toronto, Ontario
- BWXT Nuclear Energy Canada Inc., Peterborough, Ontario
- Nuclear substance processing facilities
- SRB Technologies (Canada) Inc., Pembroke, Ontario
- Nordion (Canada) Inc., Ottawa, Ontario
- Best Theratronics Ltd., Ottawa, Ontario
- BWXT Medical Ltd., Ottawa, Ontario
Each year, CNSC inspectors and experts complete inspections at these facilities. The number and scope of inspections at each facility depend on the potential hazards (risks) the facility poses to people and the environment and its performance history. The CNSC uses a risk-informed approach when planning inspections. Over the reporting period, CNSC staff performed a total of 13 inspections at the UNSPFs. These inspections resulted in the issuance of 35 notices of non-compliance (NNCs), which were all related to issues identified as being of low safety significance. In addition, to ensure that non-proliferation obligations were met, 29 International Atomic Energy Agency–initiated safeguards verification activities and 1 CNSC-initiated safeguards field activity were performed at the UNSPFs. No NNCs resulted from these regulatory activities.
The CNSC uses 14 safety and control areas (SCAs) to evaluate the performance of each licensee; the resulting performance ratings are included in this report. Particular focus is placed on the radiation protection, environmental protection, and conventional health and safety SCAs, as these give a good overview of safety performance.
The SCA ratings in this report were derived from the results of activities conducted by CNSC staff to verify licensee compliance. These activities included onsite and virtual inspections, technical assessments, reviews of reports submitted by licensees, reviews of events and incidents, and ongoing exchanges of information with licensees. For the reporting period, CNSC staff rated all SCAs as satisfactory for all facilities covered in this report and confirmed that all were operating safely.
The facilities discussed in this report lie within the traditional and/or treaty territories of many Indigenous Nations and communities. In 2021, CNSC staff undertook ongoing and meaningful engagement activities with Indigenous Nations and communities in relation to the facilities covered by this regulatory oversight report. These engagement activities support the CNSC’s commitment to meeting its consultation responsibilities and continuing to build and strengthen positive relationships with Indigenous Nations and communities.
This report is available on the CNSC website, and the documents referenced in it are available upon request by contacting:
Senior Tribunal Officer, Commission Registry
Tel.: 613-858-7651 or 1-800-668-5284
Fax: 613-995-5086
Email: interventions@cnsc-ccsn.gc.ca
2 Overview
Through the application of the Nuclear Safety and Control Act (NSCA) Footnote 1 and its associated regulations, the Canadian Nuclear Safety Commission (CNSC) regulates Canada’s nuclear industry to protect the health and safety of persons and the environment and to implement Canada’s international commitments on the peaceful use of nuclear energy. The CNSC also disseminates objective scientific, technical and regulatory information to the public. Licensees are responsible for operating their facilities safely, and are required to implement programs that make adequate provision for meeting legislative and regulatory requirements and licence conditions.
This regulatory oversight report (ROR) provides an overview of CNSC regulatory efforts and staff’s assessment of uranium and nuclear substance processing facilities (UNSPFs) in Canada for the 2021 calendar year.
The facilities covered by this report are:
- Uranium processing facilities 1
- Cameco Corporation Blind River Refinery, Blind River, Ontario (FFOL-3632.00/2032)
- Cameco Corporation Port Hope Conversion Facility, Port Hope, Ontario (FFOL-3631.00/2027)
- Cameco Fuel Manufacturing Inc., Port Hope, Ontario (FFL-3641.00/2023)
- BWXT Nuclear Energy Canada Inc., Toronto, Ontario (FFL-3621.00/2030)
- BWXT Nuclear Energy Canada Inc., Peterborough, Ontario (FFL-3620.00/2030)
- Nuclear substance processing facilities 1
- SRB Technologies (Canada) Inc., Pembroke, Ontario (NSPFL-13.00/2034)
- Nordion (Canada) Inc., Ottawa, Ontario (NSPFOL-11A.01/2025)
- Best Theratronics Ltd., Ottawa, Ontario (NSPFOL-14.00/2029)
- BWXT Medical Ltd. (formally BWXT Technologies Ltd.), Ottawa, Ontario (NSPFL-15.00/2031)
1 Each alpha-numeric expression refers to the licence held by the licensee, where FFOL = fuel facility operating licence; FFL = fuel facility licence; and NSPFOL = nuclear substance processing facility operating licence.
This report discusses all safety and control areas (SCAs), but focuses on radiation protection, environmental protection, and conventional health and safety, as they provide a good overview of safety performance at licensed facilities. The report also provides an overview of licensee operations, licence changes, major developments at licensed facilities and sites, and reportable events. In addition, the report includes information on engagement with Indigenous Nations and communities, public information programs, and COVID-19 responses by the CNSC and the licensees.
3 Uranium processing facilities
Uranium processing facilities are part of the nuclear fuel cycle that includes refining, conversion and fuel manufacturing. The fuel produced is used in nuclear power plants for the generation of electricity.
3.1 Cameco Blind River Refinery
Cameco Corporation owns and operates the Blind River Refinery (BRR), in Blind River, Ontario. The facility is located about 5 km west of the town of Blind River and south of Mississauga First Nation, as shown in figure 2-1. The facility is located within the Robinson-Huron and Robinson-Superior Treaties territory and the traditional territory of the Anishinabek, Métis and Odawa peoples, in particular Mississauga First Nation.
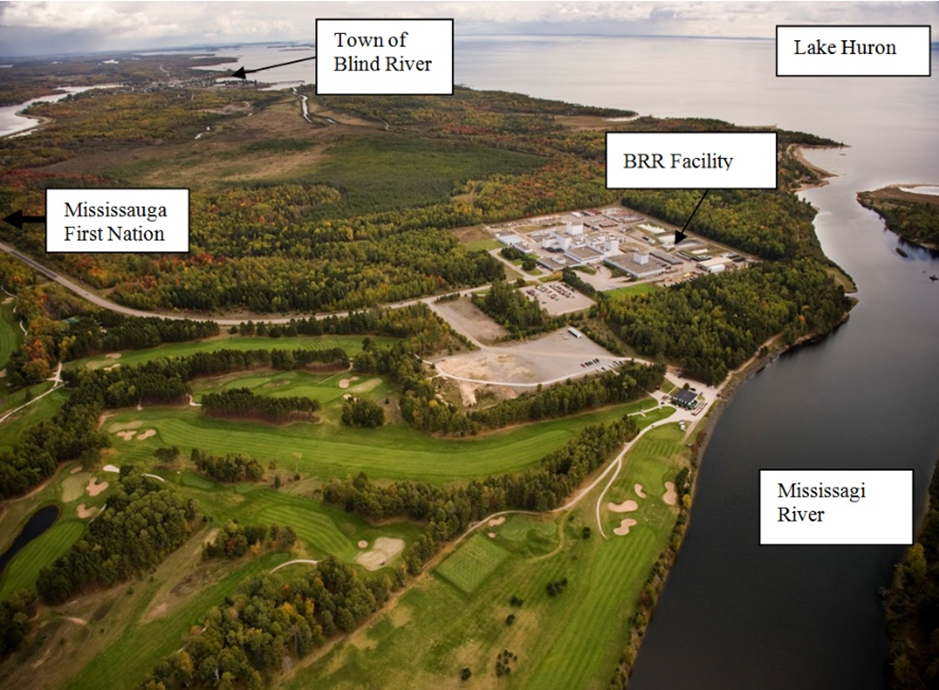
(Source: Cameco)
The BRR facility refines uranium concentrates (yellowcake) received from uranium mines in Canada and around the world to produce uranium trioxide (UO3), an intermediate product of the nuclear fuel cycle. The primary recipient of the UO3 is Cameco’s Port Hope Conversion Facility.
In 2021, CNSC staff conducted 2 inspections at the BRR that covered 8 SCAs. Table B-1 in appendix B lists these inspections and the 9 resulting notices of non-compliance (NNCs).
CNSC staff are satisfied that Cameco’s BRR operated safely in 2021 and in accordance with its licensing basis.
3.1.1 2021 BRR licence renewal
In November 2021, the Commission conducted a virtual public hearing on the renewal of Cameco’s BRR operating licence. CNSC staff’s assessment of the renewal application was presented publicly during the hearing as Commission member document CMD 21-H9.
In February 2022, the Commission made a decision on the Cameco BRR licence renewal application, as documented in the Record of Decision. In its decision, the Commission renewed Cameco’s BRR licence (FFL-3632.00/2032) for a period of 10 years and accepted the proposed new financial guarantee.
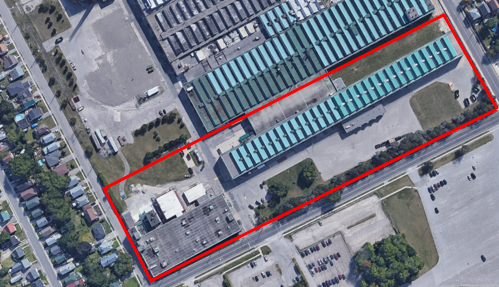
3.2 Cameco Port Hope Conversion Facility
Cameco Corporation owns and operates the Port Hope Conversion Facility (PHCF), which is located in Port Hope, Ontario, within the traditional territory of the Wendat, Anishinabek Nation, and the territory covered by the Williams Treaties with the Michi Saagiig and Chippewa Nations. The facility is situated on the north shore of Lake Ontario, approximately 100 km east of Toronto. Figure 2‑2 shows an aerial view of the PHCF.
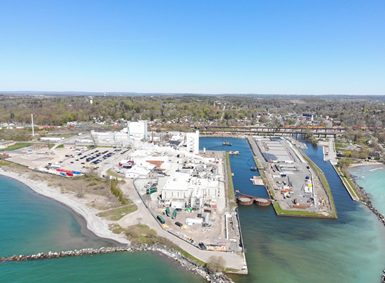
(Source: Cameco)
PHCF converts UO3 powder produced by Cameco’s BRR into uranium dioxide (UO2) and uranium hexafluoride (UF6). UO2 is used in the manufacturing of Canada Deuterium Uranium (CANDU) reactor fuel, while UF6 is exported for further processing before being converted into fuel for light-water reactors.
In 2021, CNSC staff conducted 4 inspections at PHCF that covered 10 SCAs, as well as compliance verification activities associated with the Vision in Motion project (discussed below). Table B-2 in appendix B lists these inspections and the 15 resulting NNCs.
CNSC staff are satisfied that Cameco’s PHCF operated safely in 2021 and in accordance with its licensing basis.
Vision in Motion
Vision in Motion (VIM) is Cameco’s project to clean up and renew the PHCF site. The project builds on work now underway through the Port Hope Area Initiative to address historic low-level radioactive waste issues in the Municipality of Port Hope. The VIM project is being carried out under Cameco’s operating licence, FFOL-3631.00/2027. Licence condition 16.1 states: "The licensee shall implement and maintain a program to carry out clean-up, decontamination and remediation work". VIM activities were significantly impacted by the continuing COVID-19 pandemic. Mobilization of field crews in early 2021 was deferred, and onsite activities were restricted to maintaining the project work areas in a safe condition and some other limited work. Crews began to remobilize in September 2021. In 2021, Cameco carried out VIM work that included:
- the preparation and transfer of stored wastes to the CNSC-licensed Canadian Nuclear Laboratories (CNL) Port Hope Project Long-Term Waste Management Facility (LTWMF); packaged waste shipments to the LTWMF were suspended temporarily in 2021 until a new waste cell was made available
- the removal of interior equipment and accumulated waste materials in Building 27 (the former UF6 plant)
- the installation of infrastructure, including the completion of outstanding construction on the new liquid hydrogen area (stage 1 commissioning initiated), feasibility-level engineering design and construction planning for the parking lot storm-water sewer system, and an early contractor involvement planning package for the deep excavation west of the harbour turning basin
3.3 Cameco Fuel Manufacturing Inc.
Cameco Fuel Manufacturing Inc. (CFM) is a wholly owned subsidiary of Cameco Corporation. CFM is located within the same Indigenous traditional and treaty territory as PHCF. CFM operates 2 facilities: a nuclear fuel fabrication facility licensed by the CNSC in Port Hope, Ontario (referred to as CFM in this report); and a metals manufacturing facility in Cobourg, Ontario, which manufactures fuel bundle and reactor components. This latter facility is not licensed by the CNSC and is not discussed further in this report. Figure 2-3 shows an aerial view of the CFM facility.
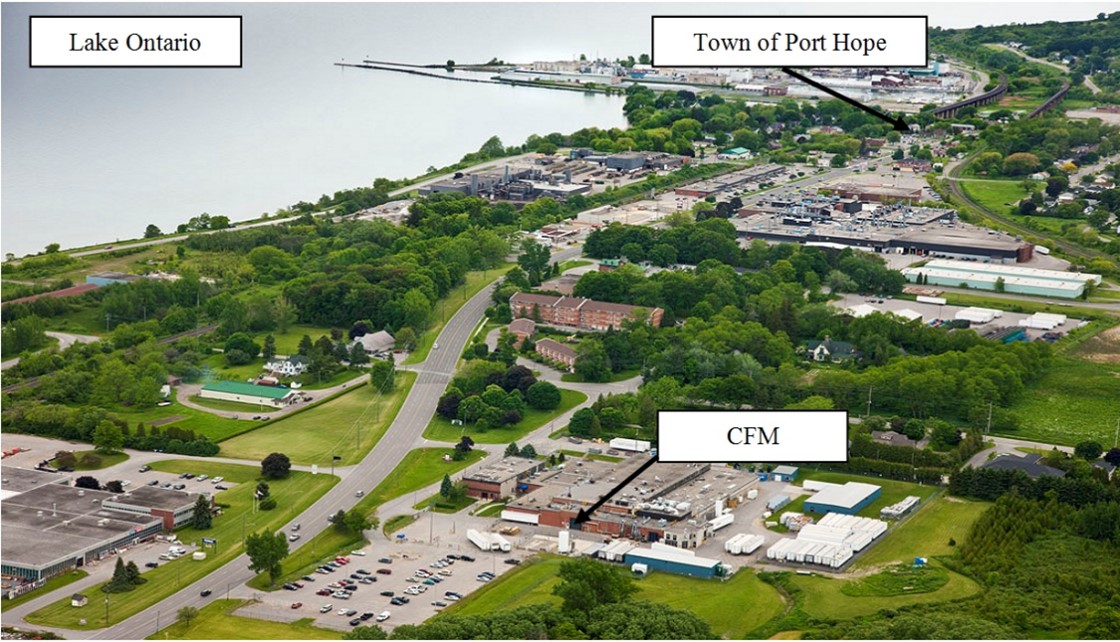
(Source: Cameco)
The CFM facility manufactures fuel pellets from UO2 powder and assembles nuclear reactor fuel bundles. The finished fuel bundles are primarily shipped to Canadian nuclear power reactors.
In 2021, CNSC staff conducted 2 inspections at CFM that covered 2 SCAs. Table B-3 of appendix B lists these inspections and the 9 resulting NNCs.
CNSC staff are satisfied that CFM operated safely in 2021 and in accordance with its licensing basis.
3.3.1 2021 CFM licence renewal
In December 2020, Cameco submitted an application for the renewal of CFM’s Class IB fuel facility licence for a 1-year period. The 1-year licence term was requested to separate CFM from the ongoing licence renewal activities for Cameco’s BRR. Following a review of Cameco’s application and supporting documents, CNSC staff’s findings and recommendations were documented in CMD 21-H105, which was reviewed by the Commission at a hearing in writing following a 60-day intervention period. In February 2022, the Commission issued its decision (Record of Decision), granting a 1-year renewal of the CFM licence, which expires on February 28, 2023.
In October 2021, Cameco submitted an application for a 20-year renewal of the CFM licence. In its application, Cameco requested an increase to the production limit from 125 tonnes of UO2 as pellets during any calendar month to 1,650 tonnes of uranium as UO2 pellets per year. CNSC staff’s CMD will be available on the CNSC website after August 9, 2022, and the deadline for written interventions is October 7, 2022. A Commission hearing is scheduled for November 23–24, 2022, to consider submissions from Cameco and CNSC staff, as well as interventions from the public and Indigenous Nations and communities.
3.4 BWXT Nuclear Energy Canada Inc.
BWXT Nuclear Energy Canada Inc. (BWXT NEC) produces nuclear fuel and fuel bundles used by Ontario Power Generation’s Pickering and Darlington nuclear generating stations. BWXT NEC has licensed operations in 2 locations: Toronto and Peterborough, Ontario. Figures 2-4 and 2-5 show aerial views of the BWXT NEC facilities. The Toronto facility is located within the traditional territory of the Mississaugas of the Credit, the Anishnabeg, the Chippewa, the Haudenosaunee and the Wendat peoples, and is now home to many diverse First Nations, Inuit and Métis peoples. The Peterborough facility resides in the traditional territory of the Michi Saagiig Anishinaabe people. These lands are covered by the Williams Treaty between Canada and the Mississaugua and Chippewa Nations.
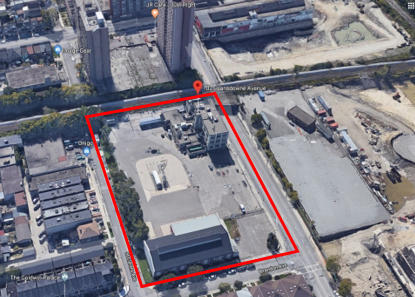
(Source: Google Maps)
(Source: Google Earth)
The Toronto facility produces CANDU nuclear fuel pellets using UO2 supplied by PHCF. The Peterborough facility manufactures CANDU nuclear fuel bundles using the uranium pellets from Toronto and zircaloy tubes manufactured in-house. The Peterborough facility also runs a fuel services business involved with the manufacturing and maintenance of equipment for use in nuclear power plants
BWXT NEC has 2 licences issued by the Commission in December 2020, 1 for Toronto and 1 for Peterborough. Therefore, 2021 was the first year of operation under the new licences, and the licensee submitted 1 annual compliance report for each licence.
In 2021, CNSC staff conducted several outreach activities related to BWXT NEC’s licence renewal, beryllium soil sampling, and operations as directed by the Commission in its Record of Decision. These activities were summarized and reported to the Commission as part of the 2020 regulatory oversight report presentation during the December 2021 Commission meeting. Additional details on this outreach are provided in section 7.2.2.
In 2021, CNSC staff conducted 1 inspection at BWXT NEC that covered 2 SCAs. Table B-4 in appendix B lists these inspections and the 1 resulting NNC.
CNSC staff are satisfied that the BWXT NEC facilities operated safely in 2021 and in accordance with their licensing basis.
4 Nuclear substance processing facilities
Nuclear substance processing facilities use nuclear substances to manufacture various products for end uses in industrial or medical applications. The nuclear substances can be used for lighting self-luminous emergency and exit signs, sterilizing items such as surgical gloves for sanitary reasons, and providing cancer diagnosis and treatment. All of the facilities are located within the traditional unceded territory of the Algonquin Anishinaabeg peoples.
4.1 SRB Technologies (Canada) Inc.
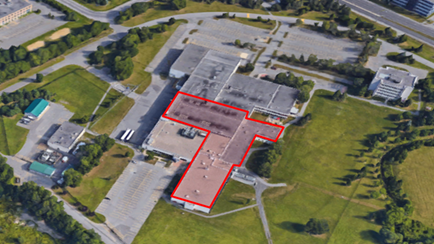
SRB Technologies (Canada) Inc. (SRBT) operates a Class IB facility manufacturing gaseous tritium light sources (GTLSs) on the outskirts of Pembroke, Ontario, located approximately 150 km northwest of Ottawa. The nuclear facility has been in operation since 1990. Figure 3-1 shows an aerial view of the SRBT facility.
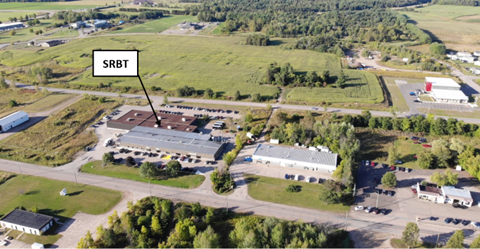
(Source: SRBT)
The SRBT facility processes tritium gas (HT) to produce sealed glass capsules coated with phosphorescent powder and filled with HT to generate continuous light. Examples of such GTLSs include signs, markers and tactical devices. SRBT distributes its products in Canada and internationally
In 2021, CNSC staff conducted 3 inspections at SRBT that covered 2 SCAs. Table B-5 in appendix B lists these inspections and the 1 resulting NNC.
CNSC staff are satisfied that SRBT operated safely in 2021 and in accordance with its licensing basis.
4.1.1 2021 SRBT licence renewal
In June 2021, CNSC staff received SRBT’s application for a 15-year renewal of its nuclear substance processing facility operating licence. In April 2022, the Commission conducted a virtual public hearing on the renewal of SRBT’s operating licence. CNSC staff’s assessment of the renewal application was presented publicly during this hearing as CMD 22-H8.
In June 2022, the Commission made a decision on SRBT’s licence renewal application, as documented in the Record of Decision. In its decision, the Commission renewed the licence (NSPFL-13.00/2034) for a period of 12 years.
4.2 Nordion (Canada) Inc.
Nordion (Canada) Inc. (Nordion) is located in Ottawa, Ontario, and is licensed to operate a Class IB nuclear substance processing facility. Figure 3-2 shows an aerial view of the Nordion facility.
(Source: Google Maps)
Nordion provides cobalt-60 (Co-60) and gamma irradiation systems for medical devices, food safety and health care industries, and innovative applications.
In 2018, the medical isotope segment of Nordion’s business was sold to BWXT Technologies, Inc. (now BWXT Medical Ltd.). Nordion is no longer licensed to operate the medical isotope facility as BWXT Medical Ltd. was granted a licence from the Commission to do so in November 2021, as documented in the Record of Decision.
There were no inspections conducted by CNSC staff at Nordion in 2021.
On the basis of the compliance verification work performed in 2021, CNSC staff are satisfied that Nordion operated safely and in accordance with its licensing basis.
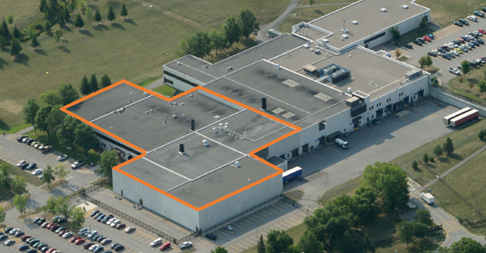
4.3 Best Theratronics Ltd.
Best Theratronics Ltd. (BTL) operates a Class 1B facility manufacturing medical devices in Ottawa, Ontario. Figure 3-3 shows an aerial view of the BTL facility.
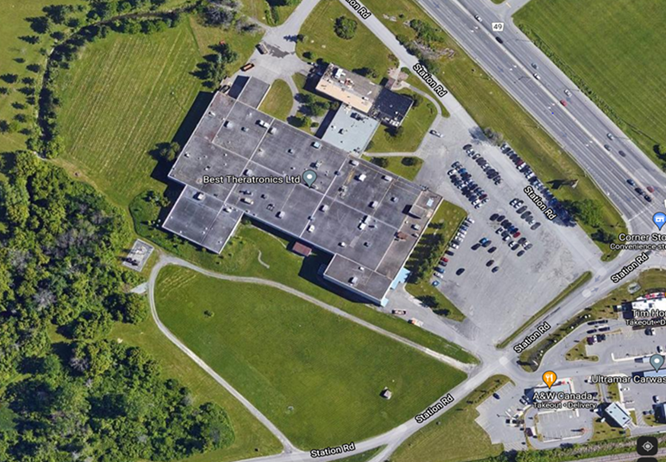
(Source: Google Maps)
BTL manufactures cyclotrons and medical equipment, including cobalt‑60 (Co‑60) based external beam radiation therapy units and cesium-137 (Cs-137) self-contained irradiators for blood irradiation.
In 2021, CNSC staff conducted 1 inspection at BTL that covered 1 SCA. Table B‑6 in appendix B lists this inspection and there were no resulting NNCs
CNSC staff are satisfied that BTL operated safely in 2021 and in accordance with its licensing basis.
4.4 BWXT Medical Ltd.
BWXT Medical Ltd. (formally BWXT Technologies Ltd.) operates a Class IB nuclear substance processing facility in Ottawa, Ontario.
(Source: Google Maps)
BWXT Medical Ltd. processes unsealed radioisotopes such as yttrium-90 and indium-111 for health and life sciences applications. The facility is composed of a nuclear medicine production facility where the radioisotopes used in nuclear medicine are processed.
No inspections were performed at the BWXT Medical facility in 2021 as it was operating under Nordion’s operating licence from January 1, 2021, to October 31, 2021.
CNSC staff are satisfied that BWXT Medical Ltd. operated safely in 2021 and in accordance with its licensing basis.
4.4.1 2021 BWXT Medical licence issuance
In August 2018, BWXT Medical Ltd. acquired Nordion’s medical isotope business. In December 2018, BWXT Medical applied for its own Class IB operating licence.
In June 2021, the Commission conducted a virtual public hearing on BWXT Medical’s Class 1B operating licence application. CNSC staff’s assessment of the application was presented publicly during this hearing as CMD 21-H5.
In October 2021, the Commission made a decision on BWXT Medical’s licence application, as documented in the Record of Decision. In its decision, the Commission issued BWXT Medical a licence (NSPFL-15.00/2031) for a period of 10 years and accepted the proposed financial guarantee.
5 CNSC regulatory oversight
The CNSC performs regulatory oversight of licensed facilities to verify compliance with the requirements of the NSCA and the associated regulations made under it, each site’s licence and licence conditions, and any other applicable standards and regulatory documents.
CNSC staff use the SCA framework to assess, evaluate, review, verify and report on licensee performance. The SCA framework includes 14 SCAs, which are subdivided into specific areas that define each SCA’s key components. Further information on the SCA framework can be found on the CNSC’s website.
5.1 Regulatory activities
CNSC staff conducted many risk-informed regulatory oversight activities at Canada’s UNSPFs in 2021. Table 4-1 presents CNSC staff’s licensing and compliance verification efforts for these facilities for the reportable year.
| Licensee | Number of inspections | Person-days for compliance verification activities | Person-days for licensing activities | Number of IAEA-initiated safeguards verification activities | Number of CNSC-initiated safeguards field activities |
|---|---|---|---|---|---|
| BRR | 2 | 165.30 | 376.2 | 7 | 0 |
| PHCF | 4 | 387.07 | 2.40 | 10 | 0 |
| CFM | 2 | 219.43 | 147.63 | 4 | 0 |
| BWXT NEC | 1 | 190.6 | 50.7 | 8* | 1** |
| SRBT | 3 | 157.13 | 194.73 | 0 | 0 |
| Nordion | 0 | 74.67 | 1.87 | 0 | 0 |
| BTL | 1 | 126.30 | 0.27 | 0 | 0 |
| BWXT Medical | 0 | 34.87 | 230.20 | 0 | 0 |
*Four IAEA-initiated inspections at Toronto and four at Peterborough (IAEA = International Atomic Energy Agency).
**One CNSC-initiated inspection at Toronto.
Compliance verification
The CNSC ensures licensee compliance through verification, enforcement and reporting activities. CNSC staff implement compliance plans for each site by conducting regulatory activities, including inspections, desktop reviews, and technical assessments of licensee programs, processes and reports.
Appendix A contains a list of annual compliance reports prepared by the licensees for the period from January to December 2021
Appendix B contains a list of CNSC inspections carried out at UNSPFs in 2021. The majority of findings in these inspections were considered to be of low risk, with 2 being of medium risk, and none had an impact on safety at the facilities.
Licensing
CNSC staff’s licensing activities include drafting new or amended licences, preparing CMDs, and drafting or revising licence conditions handbooks (LCHs).
When CNSC regulatory documents are published, CNSC staff update the LCHs as applicable for each site, taking into consideration the licensee’s implementation plans. Appendix C provides a list of changes to UNSPF licences and LCHs. CNSC staff verify the implementation as part of ongoing compliance verification activities. Appendix D provides a list of CNSC regulatory documents implemented in 2021 at UNSPFs and used by CNSC staff for compliance verification. Appendix E presents the financial guarantee amounts for each facility.
IAEA safeguards activities
Under the terms of the Canada–IAEA safeguards agreements, the IAEA performs verification activities to confirm that all nuclear material in Canada remains in peaceful use. The CNSC regulatory framework requires Canadian operators to provide the access, assistance and information required for the IAEA to complete its activities. CNSC staff ensure operator compliance with these requirements.
5.2 Performance ratings, 2021
CNSC staff assign performance ratings to licensees based on the results of regulatory oversight activities.
These ratings are either "satisfactory" (SA) or "below expectations" (BE) for the UNSPF (2021). The "fully satisfactory" (FS) rating has not been in use since 2019.
For 2021, CNSC staff rated the performance in each SCA as SA for all UNSPFs. Appendix F provides the SCA ratings for each licensee from 2017 to 2021.
6 CNSC assessment of safety at uranium and nuclear substance processing facilities
The CNSC regulates all aspects of safety at nuclear sites in Canada, including risks to workers, the public and the environment. All 14 SCAs, discussed in the following paragraphs, have been assessed. Detailed information is provided on radiation protection, conventional health and safety, and environmental protection, since these 3 SCAs are considered the most indicative of safety performance at UNSPFs. In particular, the SCAs of radiation protection and conventional health and safety are a good measure of the safety of workers, while the SCA of environmental protection is an appropriate measure of the safety of people and the environment.
6.1 Management system
The management system SCA covers the framework that establishes the processes and programs required to ensure that an organization achieves its safety objectives, continuously monitors its performance against these objectives, and fosters a healthy safety culture.
CNSC staff assess performance in the management system SCA by verifying the compliance of licensee documents and programs through desktop reviews and through compliance verification inspections that are planned or reactive. The specific areas assessed within the management system include organization; planning and controlling business activities; resource management; communication; safety culture; change management; information management; work management; problem identification and resolution; and performance assessment, improvement and management review.
NNCs from inspections related to the management system SCA were issued for the following licensees over the reporting period:
- PHCF – 3 NNCs related to document review processes (documenting processes, timeliness, traceability and transparency)
- SRBT – 1 NNC related to ensuring that supplier evaluations are performed to confirm the initial and ongoing acceptability of the supplier’s management system
- BWXT NEC – 1 NNC related to the frequency of reviewing elements of the management system
The licensees have taken all necessary corrective actions to address the above-noted NNCs. The findings were of low safety significance and did not affect the health and safety of workers, people or the environment, or the safe operation of the facilities.
CNSC staff concluded that the UNSPFs met regulatory requirements and maintained and implemented satisfactory management system programs for the reportable year. CNSC staff will continue to monitor performance through regulatory oversight activities pertaining to this SCA.
6.2 Human performance management
The human performance management SCA covers activities that enable effective human performance through the development and implementation of processes that ensure a sufficient number of licensee personnel are in all relevant job areas and have the necessary knowledge, skills, procedures and tools in place to safely carry out their duties.
CNSC staff assess performance in the human performance management SCA by verifying the compliance of licensee documents and programs through desktop reviews and through compliance verification inspections that are planned or reactive. For this SCA, CNSC staff verify that licensees are in compliance with REGDOC-2.2.2, Personnel Training [2], and their documented personnel training programs.
NNCs from inspections related to the human performance management SCA were issued for the following licensees over the reporting period:
- CFM – 5 NNCs related to the documentation and records for the systematic approach to training (SAT) implemented onsite
- PHCF – 4 NNCs based on findings related to the SAT-based personnel training program
The licensees have taken all necessary corrective actions to address the above-noted NNCs. The findings were of low safety significance and did not affect the health and safety of workers, people or the environment, or the safe operation of the facilities.
CNSC staff concluded that the UNSPFs implemented and maintained effective programs specific to personnel training and met regulatory requirements. CNSC staff will continue to verify that licensees are in compliance with the requirements for their programs and procedures, as part of ongoing regulatory oversight activities.
6.3 Operating performance
The operating performance SCA includes an overall review of the conduct of the licensed activities and the activities that enable effective performance.
CNSC staff assess performance in the operating performance SCA by verifying that policies, programs, methods and procedures are in place for the safe operation and maintenance of nuclear facilities. Verification of compliance with the requirements of this SCA is included as part of the CNSC’s compliance verification activities, including desktop reviews of annual reports, reviews of event reports and related corrective actions, and planned or reactive inspections.
There were no NNCs from inspections related to the operating performance SCA for the licensees covered in this report. CNSC staff concluded that the UNSPFs implemented and maintained effective operating programs in order to ensure that licensed activities are conducted safely and in compliance with regulatory requirements. CNSC staff will continue to monitor performance through regulatory oversight activities pertaining to this SCA.
6.4 Safety analysis
The safety analysis SCA includes maintenance of the safety analysis that supports the overall safety case for the facility. Safety analysis is a systematic evaluation of the potential hazards associated with the conduct of a proposed activity or facility and considers the effectiveness of preventive measures and strategies in reducing the effects of such hazards.
CNSC staff assess performance in the safety analysis SCA by verifying the compliance of licensee documents and programs through desktop reviews and through compliance verification inspections that are planned or reactive. CNSC staff verify that licensees maintain safety analysis reports (SARs) that include updated information on the description of the facility and the measures in place to protect the safety of workers, the public and the environment under normal operations, abnormal operations and accident conditions. CNSC staff asses the SARs to ensure that they provide an assessment of the potential consequences and demonstrate the safety case through defence in depth.
There were no NNCs from inspections related to the safety analysis SCA for the licensees covered in this report. CNSC staff concluded that the UNSPFs met regulatory requirements and maintained satisfactory ratings in the safety analysis SCA for the reportable year. CNSC staff will continue to monitor performance through regulatory oversight activities pertaining to this SCA.
6.5 Physical design
The physical design SCA relates to activities that affect the ability of structures, systems and components to meet and maintain their design basis, given new information arising over time and taking changes in the external environment into account.
CNSC staff assess performance in the physical design SCA by verifying the compliance of licensee documents and programs through desktop reviews and through compliance verification inspections that are planned or reactive. CNSC staff verify compliance with the physical design SCA requirements by ensuring the implementation of national codes and standards for structural design and by maintaining authorized inspection agency formal agreements, including those relating to pressure-retaining programs where applicable.
There were no NNCs from inspections related to the physical design SCA for the licensees covered in this report. CNSC staff concluded that the UNSPFs met regulatory requirements and maintained satisfactory ratings in the physical design SCA for the reportable year. CNSC staff will continue to monitor performance through regulatory oversight activities pertaining to this SCA.
6.6 Fitness for service
The fitness for service SCA covers activities that affect the physical condition of structures, systems and components to ensure that they remain effective over time. This includes programs that ensure that all equipment is available to perform its intended design function when called upon to do so.
CNSC staff assess performance in the fitness for service SCA by verifying the compliance of licensee documents and programs through desktop reviews and through compliance verification inspections that are planned or reactive. CNSC staff verify that the programs cover activities that affect the physical condition of structures, systems and components over time. Specific areas are assessed within this SCA to ensure that the fitness for service programs are supported by detailed procedures on preventative maintenance, the measuring and testing of equipment, and new equipment validation.
An NNC from inspections related to the fitness for service SCA was issued for the following licensee over the reporting period:
- BRR – 1 NNC related to timeliness in addressing identified moderate- to high-risk deficiencies
The licensee has taken all necessary corrective actions to address the above-noted NNC. The finding was of medium safety significance and did not affect the health and safety of workers, people or the environment, or the safe operation of the facility.
CNSC staff concluded that the UNSPFs met regulatory requirements and maintained satisfactory ratings in the fitness for service SCA for the reportable year. CNSC staff will continue to monitor performance through regulatory oversight activities pertaining to this SCA.
6.7 Radiation protection
The radiation protection SCA covers the implementation of a radiation protection program in accordance with the Radiation Protection Regulations Footnote 3. The program must ensure that contamination levels and radiation doses received by individuals are monitored, controlled and maintained as low as reasonably achievable (ALARA).
NNCs from inspections related to the radiation protection SCA were issued for the following licensees over the reporting period:
- BRR – 1 NNC related to the frequency of reviews of the contractor orientation workbook and quick reference card
- PHCF – 1 NNC related to surface contamination within the UF6 and UO2 plant operations
The licensees have taken corrective actions to address the above-noted NNCs. The findings were of low safety significance and did not affect the health and safety of workers, people or the environment, or the safe operation of the facilities. CNSC staff rated the radiation protection SCA at all UNSPFs as satisfactory.
Appendix J contains data on doses to workers for the UNSPFs from 2017 to 2021.
Application of ALARA
CNSC staff confirmed that all UNSPFs continued to implement radiation protection measures to keep radiation exposures and doses to persons ALARA. The CNSC requirement for licensees to apply the ALARA principle has consistently resulted in these doses staying well below regulatory dose limits.
Worker dose control
Radiation protection programs include dosimetry methods, identification of workers requiring nuclear energy worker (NEW) status, and the methods for radiation safety of workers. Radiation protection programs vary, depending on the radiological hazards present and the expected magnitude of doses received by workers. CNSC staff confirmed that all UNSPFs monitored and controlled the radiation exposures and doses received by all persons present at their licensed facilities, including workers, contractors and visitors. Direct comparison between facilities of doses received by NEWs does not necessarily provide an appropriate measure of a licensee’s effectiveness in implementing its radiation protection program, since radiological hazards differ across these facilities due to complex and varying work environments.
In this report, summaries of the urine analysis results on the concentration of uranium in the urine of NEWs at the uranium processing facilities have been provided at the direction of the Commission, as set out in the BRR Record of Decision. This is new information to complement the worker dose statistics reported in Appendix J. For each uranium processing facility, a summary of the urine analysis program is provided, along with the urine analysis results for the years 2017 to 2021.
The urine analysis program at each uranium processing facility is unique and has been designed to monitor worker exposures resulting from chronic and acute inhalation and ingestion of uranium products. The purpose of the urine analysis program is two-fold, in that it may be used for dosimetric purposes and for monitoring concentrations of uranium in urine that could be indicative of chemical toxicity. Note that each program has varying inputs that result in identical action levels being associated with a different assigned dose or kidney burden.
The general classification system for inhaled compounds according to their solubility or retention in the human body is as follows: type F (fast), type M (medium), and type S (slow). Uranium products of all solubilities are found in CNSC-licensed uranium processing activities. With the exception of inhaled insoluble (i.e., type S) uranium compounds, the chemical toxicity of uranium to the kidneys is more of a concern from a health perspective than its radiological characteristics. For all uranium processing facility licensees, the action levels for uranium concentrations in urine are set at levels that consider the corresponding chemical toxicity reference limit of 3 µg of uranium per gram (U/g) of kidney tissue Footnote 4. This chemical toxicity reference limit is based on a vast body of peer-reviewed literature and is accepted internationally. It limits potential reversible and irreversible effects to the kidneys resulting from uranium’s chemical toxicity as a heavy metal. Remaining below this limit has been shown to be protective in situations of either acute or chronic exposures to uranium.
In 2021, no worker urine samples exceeded the action level for uranium at any of the uranium processing facilities.
Radiation protection program performance
CNSC staff conducted regulatory oversight activities at the UNSPFs to verify that the licensees’ radiation protection programs complied with regulatory requirements. These oversight activities included inspections, desktop reviews, and compliance verification activities specific to radiation protection. Through these activities, CNSC staff confirmed that all licensees have effectively implemented their radiation protection programs to control occupational exposures to workers and keep doses ALARA.
Action levels
The following radiation protection action level exceedances were reported to the CNSC:
- In June 2021, a CFM worker’s lung dose assignment was determined to be 5.9 mSv, which exceeds the annual action level of 5 mSv for lung dose. Cameco’s investigation into the exceedance identified that a requirement for the use of respiratory protection during a specific work activity was not included in the work instruction for the activity, nor was it part of the worker training and supervisor oversight activities. Corrective actions were implemented, including updating the work instructions for this work activity to include the respirator requirement and communicating this requirement to workers and supervisors.
- In November 2021, a PHCF worker’s whole-body dosimeter recorded a dose of 2 mSv, which is the monthly action level for whole-body dose. Cameco’s investigation identified that the worker performed work activities with the potential for increased external radiation exposures. Corrective actions were implemented, including updating the work instructions for these work activities to include the use of direct-reading dosimeters to track radiation doses in real time. This will make it easier for immediate action to be taken if worker doses approach and/or reach a pre-set cumulative dose control limit.
Radiological hazard control
CNSC staff verified that UNSPFs continued to implement adequate measures to monitor and control radiological hazards in their facilities. These measures included delineation of zones for contamination control purposes and in-plant air-monitoring systems. Licensees demonstrated that they have implemented workplace monitoring programs to protect workers. The licensees have also demonstrated that levels of radioactive contamination were below limits within their facilities throughout the year.
Conclusion
CNSC staff concluded that the UNSPFs implemented and maintained effective radiation protection programs for the reportable year. The licensees’ programs are effective in ensuring the health and safety of persons working in their facilities. CNSC staff will continue to monitor performance through regulatory oversight activities pertaining to this SCA.
6.8 Conventional health and safety
The conventional health and safety SCA covers the implementation of a program to manage workplace safety hazards and to protect workers.
Based on regulatory oversight activities, CNSC staff rated the performance of all UNSPFs as "satisfactory" for the conventional health and safety SCA.
Appendix K contains health and safety information for each UNSPF from 2017 to 2021.
Performance
Employment and Social Development Canada (ESDC) and the CNSC regulate conventional health and safety programs at UNSPFs. CNSC staff monitor compliance with regulatory reporting requirements and, when a concern is identified, consult with ESDC staff.
Licensees are required to report to the CNSC as directed by section 29 of the General Nuclear Safety and Control Regulations Footnote 5, including reports on serious illnesses or injuries incurred or possibly incurred as a result of a licensed activity.
A key performance measure for the conventional health and safety SCA is the number of lost-time injuries (LTIs) that occur per year. An LTI is an injury that takes place at work and results in the worker being unable to return to work to carry out their duties for a period of time. LTIs were recorded for the following licensees over the reporting period:
- BWXT NEC Peterborough – 1 LTI where a worker handling pneumatic piping experienced back pain and stiffness executing a non-licensed activity, resulting in 2 days of lost time
- BWXT Medical – 1 LTI where an employee overexerted their arm attempting to open a hot cell door incorrectly, resulting in 3 days of lost time
Practices
Licensees are responsible for developing and implementing conventional health and safety programs for the protection of their workers. These programs must comply with Part II of the Canada Labour Code Footnote 6.
CNSC staff conducted desktop reviews and inspections at all UNSPFs to verify the compliance of the licensees’ conventional health and safety programs with regulatory requirements.
An NNC from inspections related to the conventional health and safety SCA was issued for the following licensee over the reporting period:
- PHCH – 1 NNC related to the identification and labelling of confined spaces
The licensee has taken all necessary corrective actions to address the above-noted NNC. The finding was of low safety significance and did not affect the health and safety of workers, people or the environment, or the safe operation of the facility.
CNSC staff concluded, based on regulatory oversight activities, that the UNSPFs met all regulatory requirements for this specific area.
Awareness
Licensees are responsible for ensuring that workers have the knowledge to identify workplace hazards and take the necessary precautions to protect against those hazards. This is accomplished through training and ongoing internal communications with workers.
During inspections, CNSC staff verify that workers are trained to identify hazards at the facilities. CNSC staff confirmed that the UNSPFs have effectively implemented their conventional health and safety programs to keep workers safe.
Action levels
The following action level exceedance was reported to the CNSC:
- In August 2021 at PHCF, the urine analysis action level of 7 milligrams of fluoride per litre (7 mg F/L) of urine was reached when a contract worker’s post-shift urine sample result was 8.3 mg F/L. It should be noted that no symptoms of acute exposure to fluoride would be expected at this level (e.g., abdominal pain, nausea, vomiting, diarrhea), and further, no symptoms were displayed by the worker. The worker was performing work involving a significant amount of welding, using welding rods containing calcium fluoride. Cameco’s investigation determined that the welding rods were the source of the fluoride exposure, as it was found that the worker had removed their respirator periodically during welding activities. Corrective actions were implemented, including a stand-down with the contracted workers to share what was learned and to reinforce the importance of wearing a respirator. In addition, extra ventilation in the work area was deployed, and signage was posted reminding anyone entering the work area that respirator use is mandatory. Cameco was able to share this industrial hygiene finding with the contractor, which will enable it to take the lessons learned from this event and apply them to future job sites.
Conclusion
CNSC staff concluded that the UNSPFs implemented their conventional health and safety programs satisfactorily for the reportable year. The programs are effective in protecting the health and safety of persons working in these facilities. CNSC staff will continue to monitor performance through regulatory oversight activities pertaining to this SCA.
6.9 Environmental protection
Protection of the environment and the public are linked in the environmental protection SCA. This SCA covers programs that identify, control and monitor all releases of radioactive and hazardous substances and the effects on the environment and people from facilities or as a result of licensed activities.
NNCs from inspections related to the environmental protection SCA were issued for the following licensee over the reporting period:
- CFM – 4 NNCs related to:
- the accuracy of program documentation on sampling of a previous discharge point
- revisions to the waste treatment effluent discharge record to improve clarity in requirements
- maintaining the required frequency for in-plant fixed-air sampling
- ensuring consistency between current practice and documented requirements pertaining to air sampler calibrations
The licensee has taken all necessary corrective actions to address the above-noted NNCs. The findings were of low safety significance and did not affect the health and safety of workers, people, the environment, or the safe operation of the facility.
Currently, all licensees covered by this ROR have acceptable environmental protection programs in place to ensure the protection of the public and the environment. CNSC staff rated the environmental protection SCA at all UNSPFs as satisfactory.
Appendix G provides the total annual releases of radionuclides for the UNSPFs from 2017 to 2021. Appendix H contains data on dose to the public from 2017 to 2021. Appendix I contains supplemental environmental data for all licensees.
Effluent and emissions control (releases)
All UNSPFs implement effluent monitoring programs commensurate with the risks of their operations. Airborne and waterborne releases of radioactive and hazardous substances at UNSPFs remained below regulatory limits in 2021.
Action levels
Action levels are a tool used to ensure that licensees are operating their facilities appropriately, in accordance with their approved program(s) and within the design and operational parameters of their wastewater treatment and air pollution control systems.
Action levels serve as an early warning system to ensure that licensees are carefully monitoring their operations and performance to prevent release limits from being exceeded. Action level exceedances are reportable to the CNSC.
Each licensee is responsible for identifying the parameters of its own program(s) to represent timely indicators of potential losses of control of the program(s). These licensee-specific action levels may also change over time, depending on operational and radiological conditions.
If an action level is reached, it triggers the licensee to determine the cause, notify the CNSC and, if applicable, take corrective action to restore the effectiveness of the environmental protection program. It is important to note that occasional action level exceedances indicate that the action level chosen is likely an adequately sensitive indicator of a potential loss of control of the program.
Licensee performance is not evaluated on the number of action level exceedances in a given period, but rather, on how the licensee responds and implements corrective actions to enhance program performance and prevent reoccurrence. Licensees are required to periodically review their action levels to validate their effectiveness.
The following environmental action level exceedances were reported to the CNSC in 2021:
- PHCF – 7 daily action level exceedances above 100 μg/L for the daily composite sample uranium result from the combined facility discharge in 2021 (October 31, November 7, 17, 18, 25, 27 and 28). These occurrences were attributed to groundwater infiltration from heavy precipitation events. Cameco has implemented corrective actions and is continuing to repair and upgrade sections of the sanitary sewer network as part of the VIM project.
CNSC staff concluded that there was no impact to workers, the public or the environment as a result of these action level exceedances. CNSC staff reviewed the licensee’s corrective actions in relation to the exceedances and are satisfied with the licensee’s responses.
Environmental management system
The CNSC requires each licensee to develop and maintain an environmental management system (EMS) that provides a framework for integrated activities related to environmental protection. The EMS is described in the environmental management program and includes activities such as the establishment of annual environmental objectives, goals and targets. Licensees conduct internal audits of their programs at least once a year. As part of regular compliance verification, CNSC staff review and assess these objectives, goals and targets. CNSC staff determined that the UNSPFs established and implemented their EMSs in compliance with CNSC regulatory requirements.
Assessment and monitoring
CNSC staff verify that UNSPFs have environmental monitoring programs commensurate with the risks of the operations at each of their facilities. The environmental monitoring programs are designed to monitor releases of radioactive and hazardous substances, and to characterize the quality of the environment associated with the licensed facility. CNSC staff determined that the UNSPFs established and implemented environmental monitoring programs in compliance with CNSC regulatory requirements, where applicable.
Environmental risk assessment
Environmental risk assessment (ERA) is a systematic process used by licensees to identify, quantify, and characterize the risk posed by contaminants and physical stressors in the environment on human and other biological receptors, including the magnitude and extent of the potential effects associated with a facility.
ERAs provide the basis for the scope and complexity of environmental monitoring programs at UNSPFs.
Facility ERAs are to be reviewed on a 5-year cycle, or more frequently if major facility changes are proposed that would trigger a predictive assessment.
Protection of people
The CNSC requires licensees to demonstrate that the health and safety of the public are protected from exposures to hazardous (non-radiological) substances released from their facilities. Licensees use effluent and environmental monitoring programs to verify that releases of hazardous substances do not result in environmental concentrations that may affect public health. CNSC staff receive reports of discharges to the environment in accordance with reporting requirements outlined in the licence and the LCH. Based on assessments of the programs at the UNSPFs, CNSC staff concluded that the public continues to be protected from facility emissions of hazardous substances.
Estimated dose to the public
The maximum dose to the public from licensed activities is calculated by considering monitoring results from air emissions, liquid effluent releases and gamma radiation. The CNSC’s requirement to follow the ALARA principle, taking into account social and economic factors, means that licensees must monitor their facilities and keep doses to the public below the annual public dose limit of 1 millisievert per year (mSv/year) prescribed in the Radiation Protection Regulations Footnote 3.
Table H-1 of Appendix H compares estimated public doses from 2017 to 2021 for the UNSPFs. Estimated doses to the public from all these facilities continued to be well below the regulatory annual public dose limit of 1 mSv/year.
Conclusion
CNSC staff concluded that the UNSPFs have implemented their environmental protection programs satisfactorily for the reportable year. The licensees’ programs are effective in protecting the health and safety of people and the environment. CNSC staff will continue to monitor performance through regulatory oversight activities pertaining to this SCA.
6.10 Emergency management and fire protection
The emergency management and fire protection SCA covers emergency plans and emergency preparedness programs that exist for emergencies and for non-routine conditions.
CNSC staff assess performance in the emergency management and fire protection SCA by verifying the compliance of licensee documents and programs through desktop reviews and through compliance verification inspections that are planned or reactive. Specific areas assessed within this SCA include licensee response to conventional and nuclear events, both onsite and offsite, and events that can affect the facility. CNSC staff ensure that comprehensive fire protection programs are also in place to minimize the risk to the health and safety of persons and to the environment from fire, through appropriate fire protection system design, fire safety analysis, fire-safe operation and fire prevention.
NNCs from inspections related to the emergency management and fire protection SCA were issued for the following licensees over the reporting period:
- BRR – 5 NNCs related to voice communication systems, emergency response team (ERT) medical evaluations, ERT training and qualifications, contamination control measures, and timeliness of the notification to the CNSC duty officer during emergency exercises
- PHCH – 4 NNCs related to document control, ERT medical evaluations, and personal protective equipment requirements during emergency exercises
The licensees have taken all necessary corrective actions to address the above-noted NNCs. The findings were of low safety significance and did not affect the health and safety of workers, people, the environment, or the safe operation of the facilities.
CNSC staff concluded that the UNSPFs met regulatory requirements and maintained satisfactory ratings in the emergency management and fire protection SCA for the reportable year. CNSC staff will continue to monitor performance through regulatory oversight activities pertaining to this SCA.
6.11 Waste management
The waste management SCA covers internal waste-related programs that form part of the facility’s operations up to the point where the waste is removed from the facility to a separate waste management facility. This SCA also covers the planning for decommissioning.
CNSC staff assess performance in the waste management SCA by verifying the compliance of licensee documents and programs through desktop reviews and through compliance verification inspections that are planned or reactive. CNSC staff ensure that the licensees properly manage wastes throughout the lifecycle of a nuclear facility, which includes maintaining an up-to-date waste inventory and ensuring continued waste tracking.
The CNSC requires that licensees have a decommissioning plan and financial guarantee to ensure that sufficient financial resources are available to fund all approved decommissioning activities. CNSC staff confirm that the financial guarantees remain valid, in effect, and sufficient.
NNCs from inspections related to the waste management SCA were issued for the following licensees over the reporting period:
- BRR – 2 NNCs related to waste disposal pathways for liquid combustible and contaminated combustible material waste
- PHCH – 1 NCC related to the physical integrity of waste drums
The licensees have taken all necessary corrective actions to address the above-noted NNCs. One of the findings at BRR was of low safety significance, while the other was of medium significance. The finding at PHCF was of low safety significance. The findings did not affect the health and safety of workers, people or the environment, or the safe operation of the facilities.
CNSC staff concluded that the UNSPFs met regulatory requirements and maintained and implemented satisfactory waste management programs for the reportable year. CNSC staff will continue to monitor performance through regulatory oversight activities pertaining to this SCA.
6.12 Security
The security SCA covers the programs required to implement and support the security requirements stipulated in the regulations, licence, orders, or expectations for the facility or activity.
CNSC staff assess performance in the security SCA by verifying the compliance of licensee documents and programs through desktop reviews and through compliance verification inspections that are planned or reactive. Specific areas assessed within this SCA include programs and procedures relating to access control, response arrangements, security practices, cyber security, and drills and exercises. CNSC staff ensure that the security programs in place prevent the loss, unauthorized removal or sabotage of nuclear substances, nuclear materials, prescribed equipment and information
Security inspections and details of security arrangements with the licensees are protected and not publicly available. There were no NNCs from inspections related to the security SCA over the reporting period.
CNSC staff concluded that the UNSPFs met regulatory requirements and maintained and implemented satisfactory security programs for the applicable reportable year. CNSC staff will continue to monitor performance through regulatory oversight activities pertaining to this SCA.
6.13 Safeguards and non-proliferation
The safeguards and non-proliferation SCA covers the programs and activities required for the successful implementation of the obligations arising from the Canada/IAEA safeguards agreements, as well as all other measures arising from the Treaty on the Non-Proliferation of Nuclear Weapons (NPT).
CNSC staff assess performance in the safeguards and non-proliferation SCA by verifying licensee compliance through desktop reviews and in-field activities, including participation in IAEA verification activities (see table 4-1). CNSC staff verify that licensees meet Canada’s international safeguards obligations as well as other measures arising from the NPT. CNSC staff ensure that the licensees have implemented and maintained effective programs to allow the implementation of both safeguards measures and non-proliferation commitments.
CNSC staff continue to monitor facility compliance with REGDOC-2.13.1, Safeguards and Nuclear Material Accountancy Footnote 8. Licensees require a licence, separate from the licensing of their operations, for the import and export of controlled nuclear substances, equipment and information identified in the Nuclear Non-proliferation Import and Export Control Regulations Footnote 9
CNSC staff concluded that the UNSPFs Footnote 2 met regulatory requirements and maintained and implemented satisfactory safeguards and non-proliferation programs for the reportable year. CNSC staff will continue to monitor performance through regulatory oversight activities pertaining to this SCA.
6.14 Packaging and transport
The packaging and transport SCA covers the safe packaging and transport of nuclear substances to and from licensed facilities. CNSC staff assess performance in the packaging and transport SCA by verifying the compliance of licensee documents and programs through desktop reviews and through compliance verification inspections that are planned or reactive. CNSC staff ensure that all elements of package design, package maintenance, and the registration for use of certified packages are in compliance with the Packaging and Transport of Nuclear Substances Regulations, 2015 Footnote 10 and Transportation of Dangerous Goods Regulations Footnote 11.
An NNC from inspections related to the packaging and transport SCA was issued for the following licensee over the reporting period:
- PHCF – 1 NNC related to transportation categorization labelling
The licensee has taken corrective actions to address the above-noted NNC. The finding was of low safety significance and did not affect the health and safety of workers, people, or the environment.
CNSC staff concluded that the UNSPFs met regulatory requirements and maintained satisfactory ratings in the packaging and transport SCA for the reportable year. CNSC staff will continue to monitor performance through regulatory oversight activities pertaining to this SCA.
2 The safeguards and non-proliferation SCA is not applicable to SRBT as there is no licence condition for the facility. SRBT manages a small quantity of depleted uranium (below exemption quantity as per the Nuclear Substances and Radiation Devices Regulations) used as a storage medium for tritium, not for its radioactive properties.
7 Indigenous consultation and engagement
7.1 CNSC staff engagement activities
The UNSPFs in Canada fall within the traditional and/or treaty territories of many Indigenous Nations and communities (see appendix M). CNSC staff’s efforts in 2021 supported the CNSC’s ongoing commitment to meet its consultation obligations and build positive relationships with Indigenous peoples with interests in Canada’s UNSPFs. CNSC staff continued to work with Indigenous Nations, communities and organizations to identify opportunities for formalized and regular engagement throughout the lifecycle of these facilities, and welcomed the opportunity to meet with Indigenous Nations and communities to discuss and address topics of interest or concern. CNSC staff also followed up with Curve Lake First Nation (CLFN) and the Algonquins of Ontario after the 2020 UNSPF ROR Commission meeting to further discuss their interventions and address their comments.
In 2021, CNSC staff’s engagement with Indigenous Nations and communities included conducting engagement activities specific to relevant licensing and Commission hearing processes, such as the June 2021 BWXT Medical licence application, the November 2021 BRR licence renewal, the November 2022 CFM licence renewal, and the April 2022 SRBT licence renewal. CNSC staff’s engagement in relation to each of these applications and regulatory processes included notifying identified Nations and communities about the application, sharing information about opportunities to participate and get involved, hosting meetings, making funding available through the CNSC’s Participant Funding Program (PFP), providing regular updates, and offering to meet to discuss any questions or concerns.
To ensure that all identified Indigenous Nations and communities (see appendix M) were made aware of this 2021 ROR, CNSC staff provided them with a notice of the PFP opportunity to review and comment on the ROR, as well as the opportunity to submit a written intervention and/or appear before the Commission as part of the Commission meeting. CNSC staff sent copies of this report to all Indigenous Nations, communities and organizations who had requested that they be kept informed of activities at the facilities covered in this report. CNSC staff also held meetings and scheduled a webinar in September 2022 with the identified Nations and communities to discuss the ROR and answer any related questions.
7.2 CNSC–Curve Lake First Nation long-term engagement terms of reference
As committed to with CLFN as part of the terms of reference (ToR) for long-term engagement with the CNSC, the update below was prepared in collaboration with CLFN representatives.
In 2020, CNSC staff started discussions with CLFN to establish a formal long-term relationship with the community, and ToR were signed between CLFN and the CNSC in February 2021. The ToR ensure that CLFN is provided with adequate and meaningful funding, support and capacity to participate in consultation and engagement activities required throughout the year. As part of the ToR, a yearly work plan is developed between the CNSC and CLFN, which provides information on the scope of work, detailed activities, and timelines associated with work items for collaboration and engagement.
In 2021, the work plan included:
- ToR maintenance and updates
- participation in the CNSC’s Independent Environmental Monitoring Program (IEMP)
- updates and discussions on specific projects and ongoing operations of existing nuclear facilities of interest (including the Darlington and Pickering nuclear generating stations and waste management facilities)
- co-jurisdictional matters of significance (i.e., Fisheries Act authorization, emergency preparedness, and thermal emissions from nuclear generating stations)
- information, communication and other topics (i.e., regulatory document updates, feedback on CNSC reporting and processes, PFP opportunities)
- developing a plan for a Curve Lake Indigenous knowledge and land use study
Even though the last item of the plan was not completed in 2021, CLFN and the CNSC are committed to developing a plan for a Curve Lake Indigenous knowledge and land use study in 2022. In 2021, CLFN and CNSC staff continued to meet monthly and work collaboratively to make progress on a number of the agreed-upon initiatives in the work plan. Through these meetings and interactions, CLFN and the CNSC have developed a good working relationship – one that has been more conducive to open and direct communication.
Topics of discussion included updates and conversations related to BWXT NEC (Toronto and Peterborough), PHCF and CFM. CNSC staff and CLFN also met to discuss CLFN’s involvement in the 2021 IEMP sampling campaign near the BWXT NEC site in Peterborough. In June 2021, CLFN observers participated in the IEMP sampling activities around that site. Having CLFN representatives participate in the sampling promotes a better understanding of sampling methods and improves input into future sampling in terms of CLFN species of interest, valued components, and potential sampling locations. CLFN also indicated its appreciation for participating in the sampling activities as it allows CLFN to better understand how the IEMP works and share insightful knowledge.
In 2021, CLFN provided feedback through its intervention on the 2020 RORs, and it continues to do so through ongoing discussions. CNSC staff have made a number of improvements to reports and documentation based on the feedback, such as including land acknowledgements for each facility and creating a separate Indigenous consultation and engagement section.
CNSC staff and CLFN continue to be committed to strengthening the relationship through ongoing, respectful dialogue to share knowledge, information on culture and history, and perspectives that help CNSC staff and CLFN learn from each other. CNSC staff will also continue to have discussions on areas of interest and on issues or concerns related to existing CNSC-regulated nuclear activities of interest to CLFN.
In 2022, CLFN and CNSC staff plan to initiate discussions and collaboration on a territory-wide study on Indigenous knowledge and land use as it relates to CNSC-regulated facilities and activities. Discussions will include the specific funding and capacity needs in order for CLFN to be able to meaningfully participate and complete these important studies and research. CLFN and CNSC staff will also continue to foster and create a safe ethical space for Indigenous knowledge to be collected and shared.
7.3 CNSC–Mississaugas of Scugog Island First Nation long-term engagement terms of reference
As committed to with the Mississaugas of Scugog Island First Nation (MSIFN) as part of the ToR for long-term engagement with the CNSC, the update below was prepared in collaboration with MSIFN representatives.
In September 2021, CNSC staff and MSIFN representatives started discussions to establish ToR for long-term engagement. The ToR were signed in March 2022, providing a formalized structure for ongoing dialogue on CNSC-regulated facilities and activities of interest in the MSIFN’s traditional and treaty territories. As part of the ToR, a yearly work plan was developed between the CNSC and MSIFN that provides information on the scope of work, detailed activities, and timelines associated with work items for collaboration and engagement. The 2022 work plan includes activities that CNSC staff and MSIFN will be working to implement throughout 2022 and beyond, including:
- participation in the CNSC’s IEMP
- collaborative annual reporting to the Commission and to the MSIFN Chief and Council
- updates and discussions on specific projects and ongoing operations of licensed nuclear facilities of interest
- enhanced information sharing and communication between the CNSC and MSIFN members
- emergency management and preparedness
The following facilities covered in this ROR are of interest in the work plan: PHCF, CFM, and BWXT NEC Toronto and Peterborough. CNSC staff and MSIFN are committed to continuing to strengthen the relationship through ongoing, respectful dialogue to share knowledge, information on culture and history, and perspectives that help CNSC staff and MSIFN learn from each other. CNSC staff will also continue to have discussions on areas of interest and concern related to CNSC-regulated nuclear activities of interest to MSIFN.
7.4 Licensee engagement activities
In 2021, CNSC staff continued to monitor the engagement work conducted by the UNSPF licensees to ensure that there was active engagement and communication with Indigenous Nations and communities interested in their facilities, and that activities were carried out in relation to the relevant licensing and Commission hearing processes that occurred in 2021.
CNSC staff confirmed that the licensees have Indigenous engagement and outreach programs. Throughout 2021, the UNSPF licensees met and shared information with interested Indigenous Nations, communities and organizations. Engagement efforts included emails, letters and meetings, as well as site visits and tours upon request. The CNSC encourages licensees to continue to develop relationships and engage with Indigenous groups who have expressed an interest in their activities.
8 Events and other matters of regulatory interest
8.1 Reportable events
Detailed requirements for reporting unplanned situations or events at UNSPFs to the CNSC are included in the applicable LCH. CNSC REGDOC-3.1.2, Reporting Requirements for Non-Power Reactor Class I Nuclear Facilities and Uranium Mines and Mills Footnote 12, came into force for UNSPFs in January 2019. Over the period covered by this report, licensees complied with the event reporting requirements of REGDOC-3.1.2.
CNSC staff are satisfied with licensees’ responses to reportable events. Licensees conducted investigations and/or implemented corrective actions for all reportable events, described below, to the satisfaction of CNSC staff. As a result, CNSC staff concluded that all UNSPFs managed operations safely and that there were no impacts to workers, the public or the environment.
Appendix L provides a summary of the reportable events that occurred at each facility over the review period. In total, there were 21 events reported in 2021, as described below, and none had an impact on the environment, the health and safety of persons, or the maintenance of national or international security.
BRR
- On November 1, 2021, a transport truck carrying uranium ore concentrate rolled backwards into a ditch at the edge of the parking lot when attempting to leave the Broken Canoe Trading Post in Mississauga First Nation near Blind River. There was no damage, injuries, or releases of nuclear material.
- On December 20, 2021, a tractor-trailer carrying 4 empty UO3 bins from the Port Hope Conversion Facility to the Blind River Refinery was involved in a traffic accident on Highway 7 near Omemee. A vehicle attempted to pass the tractor-trailer, causing a collision with an oncoming vehicle that subsequently hit the tractor. There was no damage, injuries, or releases of nuclear material.
PHCF
- On April 17, 2021, a small release of argon occurred from a valve on a tank outside Building 22. An investigation determined that the tank pressure was slightly higher than normal following the previous tank filling, causing the valve to open to release pressure as designed. Approximately 10 m3 was released before a contractor closed the valve. With the tank pressure reduced to normal, the valves were re-opened and there was no further leakage. Additional actions were not required since the tank operated as intended.
- On June 3, 2021, the ERT was activated in response to a UO2 discharge from a vacuum exhaust system at Building 24. An investigation determined that the vacuum system collector was overfilled, forcing the contents to be discharged to the environment. Samples were taken around Building 24 to verify that the release was localized to the area immediately outside the exhaust line. It was estimated that less than 1 g of uranium was released. The vacuum system was taken out of service and restarted once the follow-up corrective actions were completed by Cameco.
- On November 29, 2021, a laundry water line at Building 20 failed at a joint connecting 2 sections and discharged laundry water to the asphalt in the yard for approximately 9 minutes. The water entered a nearby catch basin, which is connected to the Port Hope Harbour via the storm sewer network. The laundry equipment and catch basins were isolated, and samples were acquired and sent for analysis. Approximately 500 L of laundry water containing less than 1 g of uranium was released. Cameco has repaired the failed laundry water line.
- On May 27, 2021, Cameco was notified by an overseas customer that a small hole was observed in the lid of a UO2 drum. The drum was likely perforated by a nail during transport. There were no injuries and no releases of nuclear material.
- On November 22 and December 13, 2021, trucks carrying full UF6 cylinders were involved in minor traffic incidents. There was no damage to the trucks or cargo. In both cases, there were no injuries and no releases of nuclear material.
BWXT NEC
- On October 22, 2021, the BWXT NEC Toronto facility experienced a power outage, which led to the activation of the facility’s Emergency Organization (EO). The power outage was not a result of onsite conditions. The City of Toronto restored power to the site about an hour after the start of the outage, and the EO response was terminated at that time. Security was maintained throughout the event.
- On November 24, 2021, a sprinkler head was activated at the BWXT NEC Peterborough facility in Building 26. The investigation determined that the most likely cause of the sprinkler head activation was freeze thaw, as the sprinkler head was exposed to unseasonably cold ambient outdoor temperatures and had insufficient antifreeze. The period of discharge was short, with water contained and cleaned up.
SRBT
- On February 19, 2021, SRBT reported that a fire alarm was triggered at the facility. A malfunction of the compressor generated a small quantity of smoke just prior to the unit’s automatically shutting down. The Pembroke Fire Department responded to the event and noted no further hazard. The compressor malfunction was likely due to a very brief power fluctuation on the municipal grid just prior to the false alarm. A momentary "brownout" caused a voltage drop on the motor under load conditions, likely leading to the generation of smoke from overheating as the motor recovered under load, and eventually an automatic safety trip on the compressor. There was no hazard to workers, the facility or the environment.
- On August 16, 2021, SRBT reported that a fire alarm was triggered at the facility. The alarm was caused by a malfunction of a hand-held, oxy-acetylene torch in Zone 3. The malfunction caused a brief excess flame that was detected by the monitoring system, resulting in the alarm. Staff in the area shut off the gas to the torch, eliminating the hazard, and once confirming a safe state had been achieved, proceeded to respond to the fire alarm in accordance with their training. The Pembroke Fire Department checked the area and the affected equipment and noted that the hazard was effectively eliminated.
Nordion
- On March 17, 2021, Nordion imported zircaloy without a licence. The Nordion supply team did not request that Nordion’s Environmental Health and Safety (EHS) team apply for a zircaloy licence on sample zircaloy tubes prior to their arrival at the Nordion site. An internal process has been developed and implemented to ensure that the EHS team is involved with future bulk purchases. The process is being formalized in a procedure.
- On April 8, 2021, Nordion did not send an annual report on the import of controlled information when submitting multiple import reports. The report was sent to the CNSC at a later date. The review of zircaloy licences has been added to the monthly EHS review. In addition, a verification step has been added to ensure the completion of reports.
- On April 22, 2021, Nordion failed to report the receipt of Category 1 C-451 sealed sources containing Co-60 from China in the Sealed Source Tracking System (SSTS) on time. The CNSC eventually received a late notification for these imported capsules. The CNSC initiated discussions with Nordion in 2021 to clarify reporting requirements for sealed sources from foreign suppliers.
- On July 13, 2021, a Gamma cell GC 220 chamber got stuck while the device was being used. The device remained in a safe state as the Co-60 source in the device did not move and remained shielded. Radiation surveys of the area showed the radiation fields to be within normal ranges. Maintenance was done the following day and the device was returned to service.
- On July 19, 2021, false fire alarms occurred due to overheated compressors. The high heat sensor was activated due to heat build-up from the compressor and the outside temperature. One of the compressors was cycling more than expected, causing the room to heat up. An air exchange duct in the heating plant was not ready at that time, thus hampering fresh air exchange. The heat detector was moved out of the direct line of exhaust. The facility worked with Project Alpha leaders to plan the new equipment and the timing of the new duct.
- On October 22, 2021, refrigerant halocarbon was released from the Nordion site chiller. A contractor removed refrigerant from a chiller in preparation for repair work. The contractor identified that one circuit had 9.1 kg of halocarbon and the other was missing 8.6 kg when compared against the nameplate quantities (what was expected to be present). The system is leak‑tested semi-annually and no leaks were identified. Thus, it was possible that the unit was undercharged from the manufacturer in 2002. There was no impact on the health and safety of persons. An investigation identified 2 potential root causes and 2 corrective actions.
- On December 4, 2021, Nordion received a shipment of Co-60 from Bruce Power. When one of the packages was prepared for unloading in Nordion’s pool, pressurized steam exited the package when the vent plug was removed. In addition, approximately 0.5 L of water drained from the package once the drain line cap was removed. This event led to localized low levels of contamination of the facility that required cleaning. The Co-60 sources inside the package did not leak; the contamination was from residual pool water from the wet loading process. On December 7, Nordion detected contamination on another package received from this same shipping campaign. The contamination was around the drain line and vent plug of the package. No contamination was detected on the truck used for the shipment. During package unloading, a fair amount of steam was observed in this package when the vent plug was removed. The root cause of the contamination was due to the residual pool water that had not been removed from the package during the loading process. Measures were taken by both Nordion and Bruce Power to avoid reoccurrence of the incident.
BTL
- On November 5, 2021, BTL exported 4 loaded Gamma cells to Southwest Research Institute, in San Antonio, Texas, in the United States, for long-term storage without a valid export licence. Each device contained a Category 2 Cs-137 source, and the export of these sources was not reported in the SSTS 7 days prior to export as required by BTL’s licence condition handbook. BTL self-disclosed these 2 non-compliances on February 25, 2022.
BWXT Medical
- In January 2021, a Cs-137 check source could not be located during an internal inventory verification. The room was being renovated at the time and it is likely, although unconfirmed during the investigation, that the check source was lost as a result of the renovations. The source activity was 157 kBq, with a dose rate of approximately 0.001 mSv/h at 10 cm. Corrective actions included improving signage and the labelling of wall‑mounted sources.
- In September 2021, a Type A package could not be located during transit, and the incident was reported immediately. The package was found and delivered to the end user 1 day later.
8.2 Public engagement
Public engagement has 2 aspects: activities carried out directly by CNSC staff, and activities carried out by licensees.
8.2.1 CNSC
The NSCA mandates the CNSC to disseminate objective scientific, technical and regulatory information to the public concerning its activities and the activities it regulates. CNSC staff fulfill this mandate in a variety of ways, including the publishing of RORs and through "meet the regulator" sessions. CNSC staff also seek out other opportunities to engage with the public and Indigenous Nations and communities, often participating in meetings or events in communities with an interest in nuclear sites. This allows CNSC staff to answer questions about the CNSC’s mandate and role in regulating the nuclear industry.
As a result of the ongoing COVID-19 pandemic, CNSC outreach in 2021 was reduced from previous years and limited to virtual events, including hosting and participating in webinars.
The CNSC awarded participant funding to assist Indigenous Nations and communities, members of the public and stakeholders in reviewing this ROR and in submitting comments to the Commission. Participant funding recipients are listed in Appendix N.
8.2.1.1 CNSC activities – BWXT NEC Peterborough
This ROR provides a follow-up on activities that were carried out in response to the Commission Record of Decision and CNSC staff’s Peterborough public engagement plan, and that were reported on in the 2020 ROR:
- CNSC staff disseminated IEMP results, held meetings with Dr. Aherne (Associate Professor, Trent University), updated facility web pages, responded to queries from the public and participated in Community Liaison Committee meetings.
- To address public concerns and to re-confirm that concentrations of beryllium in air are below the provincial air quality standard, CNSC staff developed a proposal in consultation with Dr. Aherne for extended air sampling in Peterborough (i.e., for a longer period of time compared to IEMP air sampling). The goal is to confirm that the air quality around BWXT NEC Peterborough meets the Ontario Ambient Air Quality Criteria for airborne releases of beryllium (0.01 µg/m3). Dr. Aherne suggested extending air sampling over at least 3 days at multiple locations around the facility to determine whether sampling over a longer period will result in any measurable beryllium. This sampling was initiated in the summer of 2022.
CNSC staff are committed to continuing to share information of interest that relates to BWXT NEC and engage with the public, Indigenous Nations and communities and other interested parties.
8.2.2 Uranium and nuclear substance processing facilities
All UNSPF licensees are required to maintain and implement public information and disclosure programs (PIDPs), in accordance with REGDOC-3.2.1, Public Information and Disclosure Footnote 13. These programs are supported by disclosure protocols that outline the type of facility information to be shared with the public and that provide details on how that information is to be shared. This ensures that timely information about the health, safety and security of persons and the environment, and other issues associated with the lifecycle of nuclear facilities, is effectively communicated to the public.
CNSC staff monitor licensee implementation of the PIDPs to ensure that communication with target audiences is regular and meaningful. CNSC staff also review yearly program updates to verify that licensees are taking public feedback into consideration and making program adjustments accordingly. All UNSPFs have approved PIDPs.
There have been many challenges due to the COVID-19 pandemic, and licensees have adapted their PIDPs accordingly, such as moving away from traditional in-person meetings and events and offering increased digital communications whenever possible. Some examples include:
- providing website updates on the pandemic and other items of interest
- providing updates to the local public and stakeholders through regular newsletters (both virtually and through direct mail)
- engaging with local/national media to provide operational and facility updates
- in lieu of in-person events and sponsorship, organizing webinars and creating new community support funds for important local efforts and for local organizations.
CNSC staff concluded that the UNSPFs met regulatory requirements and maintained and implemented satisfactory PIDPs for the reportable year.
8.3 CNSC Independent Environmental Monitoring Program
In addition to licensees performing the required monitoring of their operations, the CNSC carries out its own IEMP sampling campaigns. The objective of the IEMP is to build Indigenous and public trust in the CNSC’s regulation of the nuclear industry, via an independent, technical environmental sampling program in publicly accessible areas around nuclear facilities, while using CNSC resources effectively and efficiently. The IEMP is separate from, but complementary to, the CNSC’s ongoing compliance verification program. Under the IEMP, samples are taken from publicly accessible areas around licensed facilities. The concentrations of radioactive and hazardous substances in those samples are measured and analyzed, and the results are compared against relevant guidelines and objectives.
In 2021, CNSC staff conducted independent environmental monitoring at SRBT and BWXT NEC Peterborough, as well as at other non-UNSPF facilities. The 2021 IEMP results demonstrate that the public, Indigenous Nations and communities, and the environment around these facilities are protected, and that no adverse environmental or health effects are expected as a result of facility operations. In addition, these results are consistent with the results submitted by the licensees. The IEMP results add to the body of evidence and supports CNSC staff’s assessment that the public and the environment in the vicinity of uranium and nuclear substance processing facilities are protected and that the licensees’ environmental protection programs are effective.
8.4 COVID-19 response
8.4.1 CNSC
In 2021, compliance activities for UNSPFs continued both remotely and onsite on a risk-informed basis in observance of relevant COVID-19 health protocols. Some inspections were rescheduled or postponed for certain SCAs where an onsite presence was necessary. In certain cases, a hybrid virtual/in-person approach was adopted to minimize in-person time onsite. Â
CNSC staff continue to conduct oversight activities during the COVID-19 pandemic to ensure the protection of the environment and the health and safety of people. Specific oversight activities completed in 2021 during the pandemic are outlined in Appendix B of this report.
8.4.2 UNSPFs
During the continued COVID-19 pandemic, operations at facilities were generally ongoing as UNSPFs instituted measures to minimize the spread of COVID-19, including, but not limited to, having workers wear face masks, limiting the number of employees in any given area, screening employees on a daily basis, and conducting voluntary testing. In addition, licensees followed all public health guidelines and additional safety protocols. All facilities maintained appropriate security measures throughout this period.
Each facility continues to evaluate new information and the risks related to COVID‑19 at their sites and in the local communities. CNSC staff are informed as changes are made by licensees to adhere to any new guidelines made available by provincial health authorities.
9 Overall conclusions
CNSC staff concluded that, in 2021, UNSPFs in Canada operated safely. This assessment was based on CNSC staff’s verification of licensee activities. Such verification included inspections, reviews of reports submitted by licensees, and reviews of events, supported by follow-up and general communication with the licensees.
For 2021, the performance ratings for all UNSPFs in all 14 SCAs were rated as satisfactory.
CNSC staff’s compliance verification activities confirmed that:
- radiation protection programs at all facilities were effective and adequately controlled radiation exposures, keeping doses ALARA
- environmental protection programs at all facilities were effective in protecting people and the environment
- conventional health and safety programs at all facilities continued to protect workers
CNSC staff concluded that the licensees discussed in this report made adequate provision to protect the health and safety of workers, to protect the public and the environment, and to meet Canada’s international obligations on the peaceful use of nuclear energy.
CNSC staff will continue to provide regulatory oversight to all licensed facilities.
10 References
Endnotes
- Footnote 1
-
Nuclear Safety and Control Act, S.C. 1997, c. 9.
- Footnote 2
-
Canadian Nuclear Safety Commission (CNSC), REGDOC-2.2.2, Personnel Training, Ottawa, Canada, 2016.
- Footnote 3
-
Radiation Protection Regulations, SOR/2000-203.
- Footnote 4
-
CNSC, REGDOC-2.7.2, Dosimetry, Volume I: Ascertaining Occupational Dose, Ottawa, Canada, 2021.
- Footnote 5
-
General Nuclear Safety and Control Regulations, SOR/2000-202.
- Footnote 6
-
Canada Labour Code, R.S.C., 1985, c. L-2.
- Footnote 7
-
CSA Group, CSA N288.6-12, Environmental Risk Assessments at Class I Nuclear Facilities and Uranium Mines and Mills, 2012.
- Footnote 8
-
CNSC, REGDOC-2.13.1, Safeguards and Nuclear Material Accountancy, Ottawa, Canada, 2018.
- Footnote 9
-
Nuclear Non-proliferation Import and Export Control Regulations, SOR/2000-210.
- Footnote 10
-
Packaging and Transport of Nuclear Substances Regulations, SOR/2015-145.
- Footnote 11
-
Transportation of Dangerous Goods Regulations, SOR/2001-286.
- Footnote 12
-
CNSC, REGDOC-3.1.2, Reporting Requirements for Non-Power Reactor Class I Nuclear Facilities and Uranium Mines and Mills, Ottawa, Canada, 2018.
- Footnote 13
-
CNSC, REGDOC-3.2.1, Public Information and Disclosure, Ottawa, Canada, 2018.
- Footnote 14
-
CNSC, REGDOC‑3.6, Glossary of CNSC Terminology, Ottawa, Canada, 2019.
- Footnote 15
-
Ontario Regulation 419/05: Air Pollution – Local Air Quality, under the Environmental Protection Act, R.S.O. 1990, c. E. 19.
- Footnote 16
-
CSA Group, CSA N288.7-15, Groundwater Protection Programs at Class I Nuclear Facilities and Uranium Mines and Mills, 2015.
- Footnote 17
-
Ontario Ministry of the Environment, Soil, Ground Water, and Sediment Standards for Use Under Part XV.1 of the Environmental Protection Act, Table 3: Full Depth Generic Site Condition Standards in a Non-Portable Ground Water Condition, 2011.
- Footnote 18
-
Canadian Council of Ministers of the Environment, Canadian Water Quality Guidelines for the Protection of Aquatic Life, 1999.
- Footnote 19
-
Canadian Council of Ministers of the Environment, Canadian Soil Quality Guidelines for the Protection of Environmental and Human Health, 1999.
- Footnote 20
-
Ontario Ministry of the Environment, Conservation and Parks, Ontario’s Ambient Air Quality Criteria, 2019.
- Footnote 21
-
Province of Ontario. Water management: policies, guidelines, provincial water quality objectives - Table of PWQOs and Interim PWQOs. Retrieved from Water management: policies, guidelines, provincial water quality objectives | ontario.ca
- Footnote 22
-
Health Canada, Guidelines for Canadian Drinking Water Quality, 2017.
- Footnote 23
-
Ontario Ministry of the Environment, Soil, Ground Water and Sediment Standards for Use Under Part XV.1 of the Environmental Protection Act, Table 1: Full Depth Background Site Condition Standards, 2011.
11 Acronyms and abbreviations
| ALARA | as low as reasonably achievable |
|---|---|
| BE | below expectations |
| Bq | becquerel |
| BRR | Blind River Refinery |
| BTL | Best Theratronics Ltd. |
| BWXT | BWX Technologies Ltd. |
| BWXT NEC | BWXT Nuclear Energy Canada Inc. |
| CAD | Canadian dollar |
| Cameco | Cameco Corporation |
| CANDU | Canada Deuterium Uranium |
| CCME | Canadian Council of Ministers of the Environment |
| CFM | Cameco Fuel Manufacturing Inc. |
| CLFN | Curve Lake First Nation |
| CMD | Commission member document |
| CNL | Canadian Nuclear Laboratories |
| CNSC | Canadian Nuclear Safety Commission |
| Co-60 | Cobalt-60 |
| CSA | Canadian Standards Association (now CSA Group) |
| DRL | derived release limit |
| EHS | Environmental Health and Safety |
| EMS | environmental management system |
| EO | Emergency Organization |
| ERA | environmental risk assessment |
| ERT | Emergency Response Team |
| ESDC | Employment and Social Development Canada |
| FFL | fuel facility licence |
| FFOL | fuel facility operating licence |
| FS | fully satisfactory |
| GBq | gigabecquerel |
| GTLS | gaseous tritium light source |
| HT | tritium gas |
| HTO | hydrogenated tritium oxide |
| HNO3 | nitric acid |
| IAEA | International Atomic Energy Agency |
| IEMP | Independent Environmental Monitoring Program |
| kBq | kilobecquerels |
| LCH | licence conditions handbook |
| LTI | lost-time injury |
| LTWMF | Long-Term Waste Management Facility |
| m3 | cubic metres |
| MECP | Ministry of the Environment, Conservation and Parks (Ontario) |
| MeV | megaelectronvolt |
| mg | milligram |
| mg/L | milligram per litre |
| MOE | Ministry of the Environment |
| MSIFN | Mississaugas of Scugog Island First Nation |
| mSv | millisievert |
| N | nitrogen |
| NEW | nuclear energy worker |
| NNC | notice of non-compliance |
| NO2 | nitrogen dioxide |
| Nordion | Nordion (Canada) Inc. |
| NOx | nitrogen oxides |
| NPT | Treaty on the Non-Proliferation of Nuclear Weapons |
| NSCA | Nuclear Safety and Control Act |
| NSPFL | nuclear substance processing facility licence |
| NSPFOL | nuclear substance processing facility operating licence |
| PFP | Participant Funding Program |
| PHCF | Port Hope Conversion Facility |
| PIDP | public information and disclosure program |
| REGDOC | regulatory document |
| ROR | regulatory oversight report |
| SA | satisfactory |
| SAR | safety analysis report |
| SAT | systematic approach to training |
| SCA | safety and control area |
| SRBT | SRB Technologies (Canada) Inc. |
| SSTS | Sealed Source Tracking System |
| TLD | thermoluminescent dosimeter |
| ToR | terms of reference |
| TSP | total suspended particulate |
| U | uranium |
| µg | microgram |
| µSv | microsievert |
| UF6 | uranium hexafluoride |
| UNSPF | uranium and nuclear substance processing facility |
| UO2 | uranium dioxide |
| UO3 | uranium trioxide |
| VIM | Vision in Motion |
12 Glossary
For definitions of terms used in this document, see REGDOC-3.6, Glossary of CNSC Terminology Footnote 14, which includes terms and definitions used in the Nuclear Safety and Control Act Footnote 1 and the regulations made under it, and in CNSC regulatory documents and other publications. REGDOC-3.6 is provided for reference and information.
A. Links to licensee websites and annual compliance reports
B. CNSC inspections
| Inspection title | Safety and control areas covered | Inspection date | Number of NNCs |
|---|---|---|---|
| CAMECO-BRR-2021-01 | Emergency management and fire protection | September 27–29, 2021 | 5 |
| CAMECO-BRR-2021-02 | Fitness for service, operating performance, physical design, radiation protection, conventional health and safety, emergency management and fire protection, and waste management | September 27–29, 2021 | 4 |
| Inspection title | Safety and control areas covered | Inspection date | Number of NNCs |
|---|---|---|---|
| CAMECO-PHCF-2021-01 | Human performance management (personnel training) | March 2–4, 2021 | 4 |
| CAMECO-PHCF-2021-02 | Management system | June 23–25, 2021 | 3 |
| CAMECO-PHCF-2021-03 | Emergency management and fire protection | September 22–23, 2021 | 4 |
| CAMECO-PHCF-2021-04 | Fitness for service, safety analysis, environmental protection, radiation protection, conventional health and safety, waste management, packaging and transport | October 18–20, 2021 | 4 |
| Inspection title | Safety and control areas covered | Inspection date | Number of NNCs |
|---|---|---|---|
| CAMECO-CFM-2021-01 | Environmental protection | February 23–25, 2021 | 4 |
| CAMECO-CFM-2021-02 | Human performance management (training) | June 15–17, 2021 | 5 |
| Inspection title | Safety and control areas covered | Inspection date | Number of NNCs |
|---|---|---|---|
| BWXT NEC-2021-01 | Management system, security | October 18–20, 2021 | 1 |
| Inspection title | Safety and control areas covered | Inspection date | Number of NNCs |
|---|---|---|---|
| SRBT-2021-01 | Management system | August 9–13, 2021 | 1 |
| SRBT-2021-02 | Emergency management and fire protection (emergency management) | October 25–27, 2021 | 0 |
| SRBT-2021-03 | Emergency management and fire protection (fire protection) | November 30 to December 2, 2021 | 0 |
| Inspection title | Safety and control areas covered | Inspection date | Number of NNCs |
|---|---|---|---|
| BTL-2021-01 | Packaging and transport | March 17–18, 2021 | 0 |
Note: Security inspection reports contain sensitive information and will not be made public.
C. Significant changes to licence conditions handbooks
| Licensee | Date | Facility licence | Summary of changes |
|---|---|---|---|
| CFM | 2021-06-30 | FFOL-3641.00/2022 | Environmental protection section updated to include revised environmental action levels, and several other SCAs revised to reflect recent versions of applicable codes/standards. One administrative change to reinsert explanatory text regarding delegation of authority. |
| BWXT NEC Peterborough | 2021-05-10 | FFL-3620.00/2030 | New licence conditions handbook issued to support issuance of new licence by the Commission. |
| BWXT NEC Toronto | 2021-05-10 | FFL-3621.00/2030 | New licence conditions handbook issued to support issuance of new licence by the Commission. |
D. Regulatory document implementation
| Document number | Document title | Version | Status |
|---|---|---|---|
| REGDOC-3.2.1 | Public Information and Disclosure | 2018 | Implemented |
| Document number | Document title | Version | Status |
|---|---|---|---|
| REGDOC-3.2.1 | Public Information and Disclosure | 2018 | Implemented |
| CSA N292.0-19 | General Principles for the Management of Radioactive Waste and Irradiated Fuel | 2019 | Implemented |
| CSA N292.3-14 | Management of Low- and Intermediate-Level Radioactive Waste | 2014 | Implemented |
E. Financial guarantees
| Facility | Amount (CAD) |
|---|---|
| BRR | $48,000,0003 |
| PHCF | $128,600,000 |
| CFM | $21,000,0004 |
| BWXT NEC Toronto | $36,062,745 |
| BWXT NEC Peterborough | $10,775,122 |
| Facility | Amount (CAD) |
|---|---|
| SRBT | $745,711.43 |
| Nordion | $45,124,748 |
| BTL | $1,800,000 |
| BWXT Medical | $10,540,000 |
3 An updated financial guarantee of $57.5 million was accepted by the Commission in February 2022 with licence FFL-3632.00/2032.
4 An updated financial guarantee of $10.8 million was accepted by the Commission in February 2022 with licence FFL-3641.00/2023.
F. Safety and control area ratings
Please note that only the ratings of "satisfactory" (SA) or "below expectations" (BE) were used for the UNSPFs. The "fully satisfactory" (FS) rating was not used, consistent with the approach used for the 2019 RORs. It is important to recognize that if a facility received an SCA rating of FS in previous RORs, and now has a rating of SA, it does not necessarily indicate a reduction in performance. The simplified rating approach considerably reduced the effort that is often needed to reach a consensus on a final rating.
| SCA | 2017 rating | 2018 rating | 2019 rating | 2020 rating | 2021 rating |
|---|---|---|---|---|---|
| Management system | SA | SA | SA | SA | SA |
| Human performance management | SA | SA | SA | SA | SA |
| Operating performance | SA | SA | SA | SA | SA |
| Safety analysis | SA | SA | SA | SA | SA |
| Physical design | SA | SA | SA | SA | SA |
| Fitness for service | SA | SA | SA | SA | SA |
| Radiation protection | SA | SA | SA | SA | SA |
| Conventional health and safety | FS | FS | SA | SA | SA |
| Environmental protection | SA | SA | SA | SA | SA |
| Emergency management and fire protection | SA | SA | SA | SA | SA |
| Waste management | SA | SA | SA | SA | SA |
| Security | SA | SA | SA | SA | SA |
| Safeguards and non-proliferation | SA | SA | SA | SA | SA |
| Packaging and transport | SA | SA | SA | SA | SA |
| SCA | 2017 rating | 2018 rating | 2019 rating | 2020 rating | 2021 rating |
|---|---|---|---|---|---|
| Management system | BE | SA | SA | SA | SA |
| Human performance management | SA | SA | SA | SA | SA |
| Operating performance | SA | SA | SA | SA | SA |
| Safety analysis | SA | SA | SA | SA | SA |
| Physical design | SA | SA | SA | SA | SA |
| Fitness for service | SA | SA | SA | SA | SA |
| Radiation protection | SA | SA | SA | SA | SA |
| Conventional health and safety | SA | SA | SA | SA | SA |
| Environmental protection | SA | SA | SA | SA | SA |
| Emergency management and fire protection | SA | SA | SA | SA | SA |
| Waste management | SA | SA | SA | SA | SA |
| Security | SA | SA | SA | SA | SA |
| Safeguards and non-proliferation | SA | SA | SA | SA | SA |
| Packaging and transport | SA | SA | SA | SA | SA |
| SCA | 2017 rating | 2018 rating | 2019 rating | 2020 rating | 2021 rating |
|---|---|---|---|---|---|
| Management system | SA | SA | SA | SA | SA |
| Human performance management | SA | SA | SA | SA | SA |
| Operating performance | SA | SA | SA | SA | SA |
| Safety analysis | SA | SA | SA | SA | SA |
| Physical design | SA | SA | SA | SA | SA |
| Fitness for service | SA | SA | SA | SA | SA |
| Radiation protection | SA | SA | SA | SA | SA |
| Conventional health and safety | SA | SA | SA | SA | SA |
| Environmental protection | SA | SA | SA | SA | SA |
| Emergency management and fire protection | SA | SA | SA | SA | SA |
| Waste management | SA | SA | SA | SA | SA |
| Security | SA | SA | SA | SA | SA |
| Safeguards and non-proliferation | SA | SA | SA | SA | SA |
| Packaging and transport | SA | SA | SA | SA | SA |
| SCA | 2017 rating | 2018 rating | 2019 rating | 2020 rating | 2021 rating |
|---|---|---|---|---|---|
| Management system | SA | SA | SA | SA | SA |
| Human performance management | SA | SA | SA | SA | SA |
| Operating performance | SA | SA | SA | SA | SA |
| Safety analysis | SA | SA | SA | SA | SA |
| Physical design | SA | SA | SA | SA | SA |
| Fitness for service | FS | FS | SA | SA | SA |
| Radiation protection | SA | SA | SA | SA | SA |
| Conventional health and safety | SA | FS | SA | SA | SA |
| Environmental protection | SA | SA | SA | SA | SA |
| Emergency management and fire protection | SA | SA | SA | SA | SA |
| Waste management | SA | SA | SA | SA | SA |
| Security | SA | SA | SA | SA | SA |
| Safeguards and non-proliferation 5 | N/A | N/A | N/A | N/A | SA |
| Packaging and transport | SA | SA | SA | SA | SA |
6 Specific IAEA reporting and verification activities are held in abeyance.
| SCA | 2017 rating | 2018 rating | 2019 rating | 2020 rating | 2021 rating |
|---|---|---|---|---|---|
| Management system | SA | SA | SA | SA | SA |
| Human performance management | SA | SA | SA | SA | SA |
| Operating performance | SA | SA | SA | SA | SA |
| Safety analysis | SA | SA | SA | SA | SA |
| Physical design | SA | SA | SA | SA | SA |
| Fitness for service | SA | SA | SA | SA | SA |
| Radiation protection | SA | SA | SA | SA | SA |
| Conventional health and safety | SA | SA | SA | SA | SA |
| Environmental protection | FS | FS | SA | SA | SA |
| Emergency management and fire protection | SA | SA | SA | SA | SA |
| Waste management | SA | SA | SA | SA | SA |
| Security | FS | FS | SA | SA | SA |
| Safeguards and non-proliferation | SA | SA | SA | SA | SA |
| Packaging and transport | SA | SA | SA | SA | SA |
| SCA | 2017 rating | 2018 rating | 2019 rating | 2020 rating | 2021 rating |
|---|---|---|---|---|---|
| Management system | SA | SA | SA | SA | SA |
| Human performance management | SA | SA | SA | SA | SA |
| Operating performance | SA | SA | SA | SA | SA |
| Safety analysis | SA | SA | SA | SA | SA |
| Physical design | SA | SA | SA | SA | SA |
| Fitness for service | SA | SA | SA | SA | SA |
| Radiation protection | SA | SA | SA | SA | SA |
| Conventional health and safety | SA | SA | SA | SA | SA |
| Environmental protection | SA | SA | SA | SA | SA |
| Emergency management and fire protection | SA | SA | SA | SA | SA |
| Waste management | SA | SA | SA | SA | SA |
| Security | SA | SA | SA | SA | SA |
| Safeguards and non-proliferation | SA | SA | SA | SA | SA |
| Packaging and transport | SA | SA | SA | SA | SA |
| SCA | 2017 rating | 2018 rating | 2019 rating | 2020 rating | 2021 rating |
|---|---|---|---|---|---|
| Management system | N/A | N/A | N/A | N/A | SA |
| Human performance management | N/A | N/A | N/A | N/A | SA |
| Operating performance | N/A | N/A | N/A | N/A | SA |
| Safety analysis | N/A | N/A | N/A | N/A | SA |
| Physical design | N/A | N/A | N/A | N/A | SA |
| Fitness for service | N/A | N/A | N/A | N/A | SA |
| Radiation protection | N/A | N/A | N/A | N/A | SA |
| Conventional health and safety | N/A | N/A | N/A | N/A | SA |
| Environmental protection | N/A | N/A | N/A | N/A | SA |
| Emergency management and fire protection | N/A | N/A | N/A | N/A | SA |
| Waste management | N/A | N/A | N/A | N/A | SA |
| Security | N/A | N/A | N/A | N/A | SA |
| Safeguards and non-proliferation | N/A | N/A | N/A | N/A | SA |
| Packaging and transport | N/A | N/A | N/A | N/A | SA |
G. Total annual releases of radionuclides directly to the environment
The CNSC is making radionuclide release data more readily accessible to the public as part of its commitment to Open Government and its mandate to disseminate this information to the public. This appendix reflects the continued commitment to provide data, within regulatory oversight reports, on the total annual releases of radionuclides.
CNSC staff have begun publishing annual releases of radionuclides to the environment from nuclear facilities on the CNSC Open Government Portal.
Direct releases of radionuclides to the environment from uranium fuel refinery, manufacturing and conversion facilities are primarily limited to uranium released to the atmosphere. As uranium is more chemically toxic than radiologically toxic, releases are monitored as total uranium. As a result, the annual load is reported in kilograms. Of these facilities, only Cameco’s BRR has direct releases to surface water, with the relevant radionuclides being uranium and radium-226.
Direct releases to the environment for SRBT are limited to atmospheric releases of tritium, and there are no direct releases to surface waters. Direct radionuclide releases to the environment for Nordion are limited to atmospheric releases. BTL does not have any airborne or liquid radiological releases. Direct releases to the environment for BWXT Medical are limited to atmospheric releases of non-radiological, hazardous substances and radionuclides released through liquid effluent.
H. Public dose data
This appendix contains information on the estimated dose to the public around UNSPFs. Considering the fact that the radiological releases from all the sites covered by this ROR remain well under the DRLs applicable to those sites, the contribution to the dose to the public from these releases remains well below the prescribed limit for the general public of 1 mSv/year, as set out in the Radiation Protection Regulations Footnote 3.
| Facility | 2017 | 2018 | 2019 | 2020 | 2021 | Regulatory limit, mSv |
|---|---|---|---|---|---|---|
| BRR | 0.005 | 0.005 | 0.005 | 0.009 | 0.009 | 1 |
| PHCF | 0.153 | 0.173 | 0.127 | 0.117 | 0.086 | 1 |
| CFM | 0.022 | 0.030 | 0.027 | 0.020 | 0.306 6 | 1 |
| BWXT NEC Toronto | 0.0175 | 0.0004 | 0.023 | 0.0057 | 0.0175 | 1 |
| BWXT NEC Peterborough | <0.001 | <0.001 | 0.0115 | <0.001 | <0.001 | 1 |
| SRBT | 0.0033 | 0.0038 | 0.0021 | 0.0024 | 0.0020 | 1 |
| Nordion | 0.000052 | 0.000067 | 0.00087 | 0.00122 | 0.00185 | 1 |
| BWXT Medical | N/A | N/A | N/A | N/A | 0.0005 7 | 1 |
| BTL 8 | N/A | N/A | N/A | N/A | N/A | 1 |
N/A = not applicable; mSv = millisievert
6 The estimated dose to the public is higher in 2021 than in previous years, but there has not been an actual increase in emissions/dose from the facility. Cameco submitted revised DRLs, which included an update to the public dose calculation formulas. The revisions included airborne and liquid emissions in the calculation and a new location for the critical receptor. Therefore, the results from 2021 cannot be compared to the results from previous years.
7 The 2021 public dose value for BWXT Medical comes from its 2021 annual compliance report and is based on the highest measurement from a thermoluminescent dosimeter at a residence location.
8 No activities occur inside the BTL facility that result in the release of radioactive material to the environment.
I. Environmental data
This appendix provides environmental data for the UNSPFs. Unless otherwise indicated, no environmental action levels were exceeded.
Blind River Refinery
Atmospheric emissions
Cameco monitors uranium, nitrogen oxides (NOx), nitric acid (HNO3), and particulates released from facility stacks. The monitoring data in table I-1 demonstrates that atmospheric emissions from the facility continued to be effectively controlled, as annual averages were consistently well below their respective licence limits between 2017 and 2021. Â
| Parameter | Value | 2017 | 2018 | 2019 | 2020 | 2021 | Licence limit |
|---|---|---|---|---|---|---|---|
| Dust collection and exhaust ventilation stack: uranium (g/h) | Annual weekly average | 0.04 | 0.05 | 0.05 | 0.05 | 0.08 | 1001 |
| Dust collection and exhaust ventilation stack: uranium (g/h) | Annual weekly maximum | 0.10 | 0.18 | 0.10 | 0.11 | 0.14 | 1001 |
| Absorber stack: uranium (g/h) | Annual weekly average | 0.01 | 0.01 | 0.01 | 0.01 | 0.01 | 1001 |
| Absorber stack: uranium (g/h) | Annual weekly maximum | 0.04 | 0.03 | 0.01 | 0.02 | 0.02 | 1001 |
| Absorber stack: NOX + HNO3 (kg NO2/h) | Annual weekly average | 1.8 | 2.3 | 3.3 | 3.2 | 2.9 | 561 |
| Absorber stack: NOX + HNO3 (kg NO2/h) | Annual weekly maximum | 4.2 | 4.8 | 5.2 | 5.4 | 4.8 | 561 |
| Incinerator stack: uranium (g/h) | Annual weekly average | <0.01 | <0.01 | <0.01 | <0.01 | <0.01 | 102 |
| Incinerator stack: uranium (g/h) | Annual weekly maximum | 0.01 | 0.01 | 0.01 | 0.01 | 0.01 | 102 |
| All stacks: Particulate (g/h) | Annual weekly average | 7.6 | 9.8 | 12 | 10 | 10 | 11,0001 |
| All stacks: Particulate (g/h) | Annual weekly maximum | 17 | 22 | 25 | 17 | 17 | 11,0001 |
HNO3 = nitric acid; g/h = gram per hour; kg/h = kilogram per hour; NO2 = nitrogen dioxide; NOx = nitrogen oxides
Note: Results less than detection limit are denoted as "<".
1 Limit based on weekly averaging
2 Limit based on daily averaging
Liquid effluent
There are 3 sources of allowable liquid effluent from the BRR facility: plant effluent, storm water runoff, and sewage treatment plant effluent. These effluents are collected in lagoons and treated, as required, prior to discharge into Lake Huron. Cameco monitors uranium, radium-226, nitrates, and pH in liquid effluents to demonstrate compliance with their respective licence limits.
Table I-2 summarizes the average monitoring results from 2017 to 2021. For 2021, the liquid discharges from the facility continued to be below (or within, in the case of pH) their respective licensed limits. In 2021, as part of its licence renewal, BRR updated the licence limits for its air and liquid release points. These exposure-based release limits ensure that releases stay below certain levels to meet human health or environmental quality criteria.
| Parameter | Value | 2017 | 2018 | 2019 | 2020 | 2021 | Licence limit |
|---|---|---|---|---|---|---|---|
| Uranium (mg/L) | Monthly average | 0.01 | 0.01 | 0.01 | 0.01 | 0.01 | 2.0 |
| Uranium (mg/L) | Monthly maximum | 0.02 | 0.03 | 0.02 | 0.02 | 0.03 | 2.0 |
| Nitrates (mg/L) | Monthly average | 14 | 20 | 21 | 19 | 18 | 1000 |
| Nitrates (mg/L) | Monthly maximum | 25 | 32 | 34 | 26 | 39 | 1000 |
| Radium-226 (Bq/L) | Monthly average | 0.01 | 0.01 | 0.01 | 0.01 | <0.01 | 1.0 |
| Radium-226 (Bq/L) | Monthly maximum | 0.01 | 0.01 | 0.01 | 0.01 | 0.01 | 1.0 |
| pH | Daily minimum | 7.3 | 7.3 | 7.2 | 7.0 | 7.3 | Min 6.0 |
| pH | Daily maximum | 8.2 | 8.5 | 8.4 | 8.4 | 8.4 | Max 9.5 |
mg/L = milligram per litre; Bq/L= becquerel per litre
Uranium in ambient air
The concentrations of uranium in the ambient air, as monitored by Cameco’s sampling network around BRR, continue to be low. All values measured were below the 0.03 µg/m3 standard for uranium set out in Ontario Regulation (O.Reg) 419/05: Air Pollution – Local Air Quality Footnote 15. In 2021, the maximum concentrations of uranium in ambient air were 0.0012 µg/m3 (Golf Course), 0.0025 µg/m3 (Southeast Yard), 0.0260 µg/m3 (East Yard), 0.0035 µg/m3 (Hydro Yard) and 0.0006 µg/m3 (Town of Blind River). The annual average concentrations for all locations were lower than the annual maximum concentrations. For example, the highest annual maximum concentration of uranium in ambient air was 0.0260 µg/m3 (East Yard), whereas the annual average concentration at this location was 0.0040 µg/m3, which is well below the O.Reg 419/05 standard.
Groundwater monitoring
Cameco is in compliance with CSA N288.7-15, Groundwater Protection Programs at Class I Nuclear Facilities and Uranium Mines and Mills Footnote 16. Cameco has an extensive groundwater monitoring program in place around the BRR facility, with 35 monitoring wells: 14 located inside the perimeter fence and 21 outside the fenceline.
Groundwater quality across the site meets the uranium standard set out in table 3 of Soil, Ground Water, and Sediment Standards for Use Under Part XV.1 of the Environmental Protection Act, published by the Ministry of the Environment (MOE) Footnote 17, as shown in table I-3.
| Parameter | 2017 | 2018 | 2019 | 2020 | 2021 | MOE standard* |
|---|---|---|---|---|---|---|
| Average uranium concentration, µg/L | 1.2 | 2.3 | 2.0 | 1.4 | 1.7 | 420 |
| Maximum uranium concentration, µg/L | 11.0 | 27.0 | 14.0 | 14.0 | 25.0 | 420 |
µg/L = microgram per litre
*MOE = Ministry of the Environment Footnote 17
Surface water monitoring
Cameco continues to monitor surface water for uranium, nitrate, radium-226, and pH at the location of BRR’s outfall diffuser in Lake Huron. The concentrations of uranium, nitrate and radium-226 as well as the pH levels in the lake remained well below the Canadian Council of Ministers of the Environment (CCME) guidelines Footnote 18. Table I-4 provides surface water monitoring results.
| Parameter | 2017 | 2018 | 2019 | 2020 | 2021 | CCME guidelines* |
|---|---|---|---|---|---|---|
| Average Uranium (µg/L) | <0.7 | <0.7 | <0.7 | <0.7 | <0.7 | 15 |
| Maximum Uranium (µg/L) | <0.7 | <0.7 | <0.7 | <0.7 | <0.7 | 15 |
| Average Nitrate (mg/L as N) | 0.2 | 0.2 | 0.1 | 0.2 | 0.2 | 13 |
| Maximum Nitrate (mg/L as N) | 0.2 | 0.2 | 0.2 | 0.2 | 0.2 | 13 |
| Average Radium-226 (Bq/L) | <0.0005 | 0.0008 | <0.0005 | <0.0005 | <0.0005 | N/A |
| Maximum Radium-226 (Bq/L) | <0.0005 | <0.0008 | <0.0005 | <0.0005 | <0.0005 | N/A |
| Average pH | 7.3 | 8.0 | 8.1 | 7.9 | 7.7 | 6.5–9.0 |
| Maximum pH | 7.7 | 8.3 | 8.2 | 7.9 | 8.3 | 6.5–9.0 |
Bq/L = becquerel per litre; mg/L = milligram per litre; µg/L = microgram per litre; CCME = Canadian Council of Ministers of the Environment
*CCME, Canadian Water Quality Guidelines for the Protection of Aquatic Life Footnote 18
Note: Results below the detection limit are denoted as "<".
Soil monitoring
Cameco collects soil samples at the 0 to 5 cm depth each year and at the 5 to 15 cm depth every 5 years in order to monitor uranium concentrations in surface soil. The purpose is to monitor the long-term effects of air emissions on soil quality resulting from the deposition of airborne uranium on soil in the vicinity of the BRR facility. The 2021 soil monitoring results remained consistent with the respective concentrations detected in previous years, as shown in table I-5; that is, that uranium in soil concentrations did not appear to increase in the area surrounding the facility.
The maximum uranium in soil concentrations measured near the facility were at Ontario’s natural background levels (up to 2.5 μg/g) and well below 23 μg/g, which is the most restrictive soil quality guideline set by the CCME for uranium (for residential and parkland land use) Footnote 19. This data demonstrates that the current BRR operations do not contribute to the accumulation of uranium in surrounding soil and that no adverse consequences to relevant human and environmental receptors are expected.
| Parameter | 2017 | 2018 | 2019 | 2020 | 2021 | CCME guidelines* |
|---|---|---|---|---|---|---|
| Average uranium concentration within 1,000 m | 1.6 | 2.0 | 2.1 | 1.4 | 1.6 | 23 |
| Average uranium concentration outside 1,000 m | 0.6 | 0.7 | 1.0 | 0.7 | 0.6 | 23 |
| Maximum uranium concentration | 2.8 | 3.7 | 3.8 | 2.5 | 2.9 | 23 |
cm = centimetre; m = metre; µg/g = microgram per gram; CCME = Canadian Council of Ministers of the Environment
*CCME, Canadian Soil Quality Guidelines for the Protection of Environmental and Human Health Footnote 19
Gamma monitoring
A portion of public dose from BRR operations is due to gamma radiation sources. Consequently, monitoring of gamma radiation effective dose rates at the fenceline of the BRR main site and the nearby golf course (the critical receptor location) is essential to ensuring that levels of potential gamma radiation exposure are maintained ALARA. The land immediately outside the perimeter fence continues to be owned and controlled by Cameco. Therefore, Cameco has set an action level for gamma dose rates of 0.25 µSv/h at the north fence only because the critical receptor location for the gamma component of dose to the public is the neighbouring golf course north of the BRR site. Cameco uses environmental thermoluminescent dosimeters (TLDs) that are replaced monthly to measure the effective dose rates for gamma radiation.
In 2021, the maximum monthly gamma measurement for the north fenceline was below the action level and all fenceline gamma measurements remain consistent with values from previous years:
- East location measured 0.46 µSv/h (no action level is in place)
- North location measured 0.18 µSv/h (Cameco’s action level is 0.25 µSv/h)
- South location measured 0.54 µSv/h (no action level is in place)
- West location measured 1.56 µSv/h (no action level is in place)
These measurements indicate that gamma dose rates are controlled and that the public is protected.
Port Hope Conversion Facility
Atmospheric emissions
Cameco monitors uranium, fluoride and ammonia released from PHCF stacks. The monitoring data in table I-6 demonstrates that the atmospheric emissions from the facility continued to be effectively controlled, as annual averages remained consistently below their respective licence limits from 2017 to 2021.
| Location | Parameter | 2017 | 2018 | 2019 | 2020 | 2021 | Licence limit |
|---|---|---|---|---|---|---|---|
| UF6 plant | Uranium | 0.0011 | 0.0014 | 0.0027 | 0.0025 | 0.0022 | 0.280 |
| UF6 plant | Fluoride | 0.021 | 0.030 | 0.018 | 0.028 | 0.029 | 0.650 |
| UO2 plant | Uranium | 0.0005 | 0.0007 | 0.0008 | 0.0006 | 0.0005 | 0.240 |
| UO2 plant | Ammonia | 1.4 | 1.7 | 2.1 | 2.0 | 2.0 | 58 |
UO2 = uranium dioxide; UF6 = uranium hexafluoride; kg/h = kilogram per hour
Liquid effluent
Cameco’s PHCF collects and evaporates its process wastewater effluent. Its operating licence does not allow for any process wastewater effluent to be discharged from PHCF, and there were no process liquid discharges from PHCF in 2021.
In compliance with the requirements of other regulators that have jurisdiction, Cameco’s PHCF monitors releases of the following point source discharges that are non-process liquid effluent: cooling water, sanitary sewer, storm sewer, and the combined backwash stream associated with the harbour water intake system.
In 2021, Cameco’s PHCF continued to observe elevated uranium concentrations in the UF6 plant and UO2 plant cooling water returns, which can be attributed to the inner harbour remedial work by CNL that involved debris removal and resulted in sediment disturbances. In addition, the CNL harbour water activities led to the diversion of surface water to the PHCF intake screen.
With respect to sanitary sewer discharges, Cameco experienced 7 action level exceedances in 2021, described in the action levels subsection of section 5.9. Cameco is continuing to repair sections of the sanitary sewer network and is upgrading it as part of the VIM project, which started to ramp back up in fall 2021. CNSC staff concluded that in 2021, Cameco met its licence requirement not to discharge process wastewater effluent and to keep the sanitary sewer discharges below their respective release limits.
Uranium in ambient air
Cameco monitors ambient air at several locations around the PHCF site to measure air quality, using high-volume air sampling of total suspended particles (TSP) (uranium from the air is collected on a filter and analyzed) to ensure that the impact of the facility’s emissions to the environment is minimized. In 2021, the highest annual average concentration of uranium in TSP in ambient air (from the 4 high-volume air sampling stations) was 0.003 μg/m3 for a 24-hour period, which is consistent with the values for the years 2018 to 2021. This value is well below the O.Reg 419/05 standard for an upper risk threshold of uranium of 1.5 μg/m3 for a 24-hour period Footnote 15.
Cameco reported 1 TSP exceedance in 2021. The measurement from a high-volume air sampler was above the Environment and Climate Change Canada and the Ontario Ministry of the Environment, Conservation and Parks (MECP) 120 µg/m3 TSP dust criteria for visibility Footnote 20. The elevated TSP level was attributed to rail-line replacement work occurring adjacent to the monitoring station. There were no impacts to the environment or to the health and safety of people.
Groundwater monitoring
Cameco is in compliance with CSA N288.7-15, Groundwater Protection Programs at Class I Nuclear Facilities and Uranium Mines and Mills Footnote 16.
The PHCF long-term groundwater monitoring program includes groundwater level monitoring and groundwater sampling at select wells. Cameco samples groundwater quality at PHCF in the following monitoring wells:
- 12 active pumping wells on a monthly basis
- 56 monitoring wells in the overburden (soil) on a quarterly basis
- 16 monitoring wells in the bedrock on an annual basis
Groundwater quality across the site in 2021 was generally consistent with that reported in previous annual monitoring reports from the licensee.
The pump-and-treat wells have been performing as expected. The operation of the pump-and-treat system has resulted in capture of the contaminant plumes originating under the footprint of the UF6 plant. The pump-and-treat systems continue to reduce the mass of groundwater contaminants entering into the harbour, at rates similar to previous years, as shown in table I-7 below.
| Parameter | 2017 | 2018 | 2019 | 2020 | 2021 |
|---|---|---|---|---|---|
| Uranium | 34.0 | 27.0 | 27.0 | 22.0 | 22.0 |
| Fluoride | 61.0 | 57.0 | 47.0 | 47.0 | 45.0 |
| Ammonia | 70.0 | 66.0 | 39.0 | 23.0 | 21.0 |
| Nitrate | 56.0 | 124.0 | 69.0 | 60.0 | 56.0 |
| Arsenic | 3.0 | 1.0 | 0.5 | 0.64 | 0.82 |
kg=kilogram
Surface water monitoring
The surface water quality in the harbour near the PHCF site has been monitored since 1977 through the analysis of samples collected from the south cooling water intake near the mouth of the Ganaraska River. The trend of surface water quality over time shows improvement since 1977 and very low uranium levels.
Surface water in the harbour is sampled at 13 locations on a quarterly basis, with samples collected at depths slightly below the water surface and slightly above the sediment layer. Beginning in 2018, these sampling locations were restricted due to CNL’s remedial harbour activities. However, PHCF has continued to monitor the cooling water intake since this is a good indication of the overall water quality under routine and baseline conditions, where routine refers to typical water quality conditions during facility operations and baseline refers to water quality conditions before this facility was in operation.
Table I-8 provides annual average and maximum concentrations of uranium, fluoride, nitrate and ammonia monitored in the harbour water from 2017 to 2021. CNL harbour isolation works and CNL harbour remedial activities have influenced the Port Hope Harbour water quality and have caused uranium concentrations in the cooling water intake to exceed the CCME water quality guideline of 15 µg U/L Footnote 18. Mechanical dredging by CNL has caused uranium concentrations to begin to increase slightly above baseline conditions, and suction dredging work is anticipated to begin in spring/summer 2022. CNL will continue to provide updates to Cameco and notify Cameco when dredging begins.
Although a maximum fluoride concentration measured in harbour water in 2021 of 0.17 mg/L exceeded the CCME freshwater guideline for the protection of aquatic life of 0.12 mg/L Footnote 18, this fluoride concentration is well below Health Canada’s drinking water standard of 1.5 mg/L Footnote 22 and the lowest toxicity benchmark for sensitive aquatic biota of 11.5 mg/L Footnote 18. This indicates safe fluoride levels for human health, and it is unlikely to cause adverse effects to aquatic biota.
| Parameter | 2017 | 2018 | 2019 | 2020 | 2021 | CCME* guidelines |
|---|---|---|---|---|---|---|
| Average Uranium (µg/L) | 3.3 | 5.2 | 5.1 | 5.0 | 70 | 15 |
| Maximum Uranium (µg/L) | 8.8 | 31 | 46 | 12 | 540 | 15 |
| Average Fluoride (mg/L) | 0.19 | 0.16 | 0.092 | 0.09 | 0.066 | 0.12 |
| Maximum Fluoride (mg/L) | 0.29 | 0.36 | 0.18 | 0.15 | 0.17 | 0.12 |
| Average Nitrate (mg/L) | 1.0 | 1.0 | 0.95 | 0.92 | 1.0 | 13 |
| Maximum Nitrate (mg/L) | 2.2 | 1.8 | 1.6 | 1.7 | 1.9 | 13 |
| Average ammonia + ammonium (mg/L) | 0.18 | 0.13 | 0.031 | 0.014 | 0.015 | 0.3 |
| Maximum ammonia + ammonium (mg/L) | 0.40 | 0.47 | 0.21 | 0.14 | 0.17 | 0.3 |
mg/L = milligram per litre; µg/g = microgram per gram; CCME = Canadian Council of Ministers of the Environment
*CCME, Canadian Water Quality Guidelines for the Protection of Aquatic Life [Footnote 18
Soil monitoring
Cameco’s annual soil monitoring program at PHCF monitors 3 locations at 3 different soil depths beyond the facility’s fenceline. Two locations are within a 0 to 500 m radius from the facility, while 1 is within a 1,000 to 1,500 m radius from the facility. One location (adjacent to the Port Hope Water Treatment Plant) contains clean fill soil to remove any potential interference from historical soil contamination of uranium.
In 2021, the uranium in soil concentrations for all sampling depths at the clean fill soil location were found to be consistent with and virtually unchanged from values obtained during previous sampling years (see table I-9 for soil sampling results for the clean fill soil location for 2017 to 2021). The results are also well below soil guidelines for residential and parkland set by the CCME in its Canadian Soil Quality Guidelines for the Protection of Environmental and Human Health Footnote 19 and are within the range of natural background levels for Ontario (up to 2.5 µg/g). The results suggest that current PHCF operations and their uranium emissions do not significantly contribute to the accumulation of uranium in soil.
Cameco has made a commitment to maintain the existing soil monitoring locations and report results to the CNSC each year. Reclamation activities, as part of the Port Hope Area Initiative, provide an opportunity for Cameco to review its soil monitoring station locations throughout the Port Hope community.
| Soil depth (cm) | 2017 | 2018 | 2019 | 2020 | 2021 | CCME guidelines* |
|---|---|---|---|---|---|---|
| 0–5 | 0.8 | 0.91 | 0.82 | 0.91 | 0.87 | 23 |
| 5–10 | 0.8 | 0.85 | 0.74 | 0.84 | 0.80 | 23 |
| 10–15 | 0.9 | 0.98 | 0.80 | 0.81 | 0.80 | 23 |
cm = centimetre; µg/g = microgram per gram; CCME= Canadian Council of Ministers of the Environment
*CCME, Canadian Soil Quality Guidelines for the Protection of Environmental and Human Health Footnote 19
Fluoride monitoring
The impact of fluoride emissions on the local environment from PHCF facility operations is determined by monitoring fluoride concentrations and visible foliar damage in vegetation at sampling locations adjacent to the facility and in the surrounding community. The vegetation monitoring program, conducted in coordination with the MECP, was modified to sample clusters of trees rather than single trees (starting in 2018). It was further modified in 2021 to remove 4 sampling sites, which was consistent with MECP feedback that these locations were not adding value to the monitoring program. In addition, some trees previously monitored needed to be replaced with others due to downed trees and CNL’s remedial work in the area. The 2021 monitoring results show the maximum fluoride concentration was 13 µg/g and 16 of 26 samples had concentrations below the laboratory’s detection limit of 5 µg/g. These values are well below the MECP’s Ambient Air Quality Criteria (AAQC) Footnote 20 value for fluoride in dry forage of 35 µg/g.
| Parameter | 2017 | 2018 | 2019 | 2020 | 2021 | MECP’s AAQC |
|---|---|---|---|---|---|---|
| Fluoride in vegetation, µg/g | 11.0 | <5.0 | <5.0 | <5.0 | <5.0 | 35 |
µg/g = microgram per gram; MECP = Ontario Ministry of the Environment, Conservation and Parks; AAQC = Ambient Air Quality Criteria
Note: For 2021, 16 of 26 samples were below the detection limit of 5 µg/g; for 2020, 28 of 33 samples were below the detection limit of 5 µg/g; for 2019, 31 of 34 samples were below the detection limit of 5 µg/g; for 2018, 29 of 34 samples were below the detection limit of 5 µg/g.
Gamma monitoring
A portion of radiological public dose from PHCF operations is from gamma radiation sources. PHCF monitors gamma radiation effective dose rates at the fenceline of the 2 sites to ensure that potential exposure levels remain ALARA. The gamma radiation effective dose rates for both sites are measured with environmental TLDs supplied by a licensed dosimetry service. As per the 2016 operating release level, the dose to the public is calculated for both Sites 1 and 2 using specific gamma fenceline monitoring locations.
The 2017 to 2021 maximum monthly doses for gamma radiation are shown in table I-11. In 2021, the maximum monthly gamma measurements were all below the respective licensed limits for this facility and remained consistent with values from previous years:
- Station 2 measured 0.21 µSv/h (licensed limit is 0.57 µSv/h)
- Station 10 measured 0.02 µSv/h (licensed limit is 0.40 µSv/h)
- Station 21 measured 0.03 µSv/h (licensed limit is 0.26 µSv/h)
These measurements indicate that gamma dose rates are controlled and the public is protected.
| Station number and site | 2017 | 2018 | 2019 | 2020 | 2021 | Licence limit |
|---|---|---|---|---|---|---|
| Station 2 – Sites 1 and 2, µSv/h | 0.25 | 0.26 | 0.20 | 0.20 | 0.21 | 0.57 |
| Station 13*/10 – Site 1, µSv/h | 0.03* | 0.07* | 0.00*/ 0.05 | 0.11 | 0.02 | 0.40 |
| Station 21 – Site 2, µSv/h | 0.08 | 0.07 | 0.06 | 0.09 | 0.03 | 0.26 |
µSv/h = microsievert per hour
*Refers to monitoring results for Station 13.
Cameco Fuel Manufacturing Inc.
Atmospheric emissions
Cameco continued to monitor uranium released as atmospheric emissions from the CFM facility. The monitoring data in table I-12 demonstrates that stack and building exhaust ventilation emissions from the facility continued to be effectively controlled, as annual averages remained consistently well below their licence limits between 2017 and 2021.
| Parameter | 2017 | 2018 | 2019 | 2020 | 2021 | Licence limit |
|---|---|---|---|---|---|---|
| Total uranium discharge through stacks, kg/year | 0.01 | 0.01 | 0.004 | 0.01 | 0.01 | 14 |
| Total uranium discharge through building exhaust ventilation, kg/year | 0.57 | 1.25 | 1.09 | 0.92 | 0.89 | 14 |
kg= kilogram
Starting in 2018, the annual uranium discharge through building exhaust ventilation was calculated using a summation of the daily release values with a total sum provided for the year. This capability was built into the CFM facility’s new environmental monitoring software and is a better reflection of day-to-day operations compared to using an average result. Previously, the annual value was calculated by adding the quarterly results (2016 and 2017) or using the annual average (2015). This caused the 2018 and subsequent annual results to be higher than in previous years due to the number of days used in the annual calculation compared to the number of days used in the quarterly calculation. The summation of the daily values is more representative of the actual building ventilation emissions.
Liquid effluent
After liquid effluent generated from the production process is collected, an evaporator process is used to remove the majority of the uranium. The condensed liquid is sampled and analyzed prior to a controlled release to the sanitary sewer line. Cameco continues to monitor uranium released as liquid effluent from the facility. The monitoring data in table I-13 demonstrates that liquid effluent from the facility in 2021 remained consistently well below the licence limit and continued to be effectively controlled.
| Parameter | 2017 | 2018 | 2019 | 2020 | 2021 | Licence limit |
|---|---|---|---|---|---|---|
| Total uranium discharge to sewer, kg/year | 0.64 | 0.84 | 0.39 | 0.34 | 0.29 | 475 |
kg= kilogram
Uranium in ambient air
Cameco operates high-volume air samplers to measure the airborne concentrations of uranium at points of impingement of stack plumes. The samplers are located on the east, north, southwest and northwest sides of the facility. In 2021, the results from these samplers showed that the highest annual average concentration of uranium in ambient air (among the sampling stations) was 0.0004 μg/m3. All of the values are well below the O.Reg 419/05 standard for uranium of 0.03 μg/m3 Footnote 15.
Groundwater monitoring
Cameco is in compliance with CSA N288.7-15, Groundwater Protection Programs at Class I Nuclear Facilities and Uranium Mines and Mills Footnote 16.
CFM has a network of 70 monitoring wells: 43 overburden, 23 shallow bedrock and 4 deep bedrock wells. Groundwater has been monitored at the site twice a year since 1999, and up to 10 pumping wells and 2 sumps were in operation during 2021.
| Parameter | 2017 | 2018 | 2019 | 2020 | 2021 | MOE standard* |
|---|---|---|---|---|---|---|
| Average dissolved uranium concentration, µg/L | 73 | 78 | 115 | 107 | 53 | 420 |
| Maximum dissolved uranium concentration, µg/L | 1900 | 2200 | 2300 | 2100 | 710 | 420 |
µg/L = microgram per litre
*MOE = Ministry of the Environment Footnote 17
Groundwater quality across the site in 2021 generally met the MOE table 3 uranium standard (420 µg/L). Concentrations of dissolved uranium in groundwater ranged from <0.1 to a maximum value of 710 µg/L across the site. Concentrations of uranium in groundwater exceeded the MOE table 3 standard in 3 of the 70 monitoring wells sampled. The exceedance of the MOE table 3 standard relates to historic waste management practices. The soil impact is confined to a small area. In the direction of groundwater flow, the closest property boundary (non-residential) is approximately 120 to 140 meters from the location of impacted soil. As stated in the ERA, the potential for offsite migration of uranium through groundwater movement is very low. The groundwater monitoring results confirmed that current operations are not contributing to the concentrations of uranium in groundwater on the licensed property. The groundwater is not used for drinking water purposes in this area.
Surface water monitoring
In 2021, Cameco collected surface water samples at 9 locations in March, September and October. The sample locations were on and adjacent to the facility, and were analyzed for uranium.
The total uranium concentrations in surface water met the interim provincial water quality objective of 5 µg/L Footnote 21 at all surface water sampling locations, except at the intermittent drainage locations SW-4 and SW-9. The majority of the surface water samples met the CCME short-term uranium guideline of 33 µg/L Footnote 18 in the intermittent drainage locations except for SW-4 and SW-9.
There were no exceedances of the CCME long-term uranium guideline of 15 µg/L Footnote 18 in the West Gage Creek. The risk to the environment from an exceedance of a CCME water quality guideline is expected to be minimal due to the conservative assumptions and safety factors that were used to derive the guideline.
CNSC staff will continue to oversee Cameco’s monitoring at locations around the vicinity of CFM to confirm that uranium concentrations remain at safe levels in surface water.
Soil monitoring
Every 3 years, Cameco collects soil samples at the 0 to 5 cm depth from 23 locations surrounding the CFM facility. Soil samples were last collected in 2019 and analyzed for uranium content. The soil monitoring results are shown in table I-15. The 2019 average uranium concentration in soil near the CFM facility is within the Ontario natural background level of up to 2.5 μg/g. The maximum concentrations detected are attributable to historical contamination in Port Hope, which has long been recognized and continues to be the focus of clean-up activities. The results for all samples were below the CCME Canadian Soil Quality Guidelines for the Protection of Environmental and Human Health Footnote 19 of 23 μg/g. This is the most restrictive guideline; therefore, no adverse consequences to human and environmental receptors are expected. The next soil samples will be collected and analyzed in 2022.
| Parameter | 2009 | 2010 | 2013 | 2016 | 2019 | CCME** guideline |
|---|---|---|---|---|---|---|
| Average uranium concentration, µg/g | 5.2 | 4.5 | 3.7 | 2.5 | 2.4 | 23 |
| Maximum uranium concentration, µg/g | 17.0 | 21.1 | 17.4 | 11.2 | 7.6 | 23 |
µg/g = microgram per gram; CCME= Canadian Council of Ministers of the Environment
*CFM reverted to a 3-year soil monitoring program in 2010.
**CCME, Canadian Soil Quality Guidelines for the Protection of Environmental and Human Health Footnote 19.
Gamma monitoring
For the CFM facility, a portion of radiological public dose is due to gamma radiation sources. Consequently, monitoring of gamma radiation effective dose rates at the fenceline of the CFM site is essential to ensuring that levels of potential gamma radiation exposure are maintained ALARA. The gamma radiation effective dose rates for the site are measured with environmental TLDs supplied by a licensed dosimetry service.
In 2021, the maximum quarterly gamma measurements were all below the respective licensed limits for this facility and remain consistent with values from previous years:
- Location 1 measured 0.02 µSv/h (licensed limit is 4.96 µSv/h)
- Location 2 measured 0.05 µSv/h (licensed limit is 0.46 µSv/h)
- Location 12 measured 0.41 µSv/h (licensed limit is 1.35 µSv/h)
These measurements indicate that gamma dose rates are controlled and that the public is protected.
BWXT Nuclear Energy Canada Inc. – Toronto and Peterborough
Atmospheric emissions
To ensure compliance with licence limits, air emissions from the BWXT NEC facilities are filtered and sampled prior to release into the atmosphere. Table I-16 provides BWXT NEC Toronto’s annual maximum uranium emissions from 2017 to 2021. Table I-17 provides BWXT NEC Peterborough’s annual maximum uranium and beryllium emissions from 2017 to 2021. The annual emissions remained well below the licence limits for both facilities. The results demonstrate that air emissions of uranium and beryllium were being controlled effectively.
| Parameter | Stack | 2017 | 2018 | 2019 | 2020 | 2021 | Licence limit |
|---|---|---|---|---|---|---|---|
| Uranium | Rotoclone | 0.180 | 0.464 | 0.077 | 0.204 | 0.197 | 65 |
| Uranium | 6H-68 | 0.160 | 0.118 | 0.111 | 0.112 | 0.461 | 47 |
| Uranium | 4H-48 | 0.130 | 0.086 | 0.037 | 0.112 | 0.072 | 97 |
| Uranium | Furnace #1 | 0.440 | 0.112 | 0.081 | 0.599 | 0.224 | 437 |
| Uranium | Furnace #2/4 | 0.150 | 0.092 | 0.103 | 0.158 | 0.395 | 55 |
| Uranium | Furnace #5/6 | 0.230 | 0.467 | 0.245 | 0.908 | 0.250 | 52 |
µg/m3= microgram per cubic metre
| Parameter | Stack | 2017 | 2018 | 2019 | 2020 | 2021 | Licence limit |
|---|---|---|---|---|---|---|---|
| Uranium | R2 Decan | 0.003 | 0.006 | 0.014 | 0.003 | 0.003 | 410 |
| Beryllium | North | 0.001 | 0.001 | 0.001 | 0.001 | 0.003 | 2.6 |
| Beryllium | South | 0.001 | 0.001 | 0.001 | 0.001 | 0.001 | 2.6 |
| Beryllium | Acid | 0.001 | 0.000 | 0.000 | 0.000 | 0.002 | 2.6 |
µg/m3= microgram per cubic metre
Liquid effluent
To ensure compliance with licence limits, wastewater from the BWXT NEC Toronto and Peterborough facilities is collected, filtered and sampled prior to its release into sanitary sewers. Table I-18 provides BWXT NEC’s annual maximum concentrations of uranium and beryllium released to the sanitary sewers from 2017 to 2021. In 2021, the releases continued to be well below the licence limits. The results demonstrate that liquid effluent releases were being controlled effectively.
| Facility | Parameter | 2017 | 2018 | 2019 | 2020 | 2021 | Licence limit |
|---|---|---|---|---|---|---|---|
| BWXT NEC Toronto | Uranium | 2.56 | 2.95 | 2.58 | 2.79 | 2.55 | 1000 |
BWXT NEC Peterborough | Uranium | 0.09 | 0.03 | 0.07 | 0.37 | 0.41 | 2500 |
| Beryllium | 0.0054 | 0.0025 | 0.0018 | 0.0091 | 0.0031 | 26 |
mg/L = milligram per litre
Uranium in ambient air
BWXT NEC Toronto operates 5 high-volume air samplers to measure airborne concentrations of uranium at points of impingement of stack plumes. The results from these samplers show that the annual average concentration of uranium in ambient air (among the sampling stations) measured around the facility in 2021 was below the minimum detection limit. This demonstrates that the results are well below the O.Reg 419/05 standard for uranium of 0.03 μg/m3 Footnote 15. Table I-19 provides air monitoring results for BWXT NEC Toronto (rounded-up values).
BWXT NEC Peterborough does not monitor uranium in ambient air because the atmospheric emissions discharged from the facility already meet the O.Reg 419/05 standard for uranium of 0.03 μg/m3 Footnote 15 at the point of release, thus eliminating the need for additional ambient monitoring.
| Parameter | 2017 | 2018 | 2019 | 2020 | 2021 |
|---|---|---|---|---|---|
| Average concentration | 0.000 | 0.000 | 0.000 | 0.000 | 0.000 |
µg/m3= microgram per cubic metre
Soil monitoring
BWXT NEC conducts soil sampling for uranium at its Toronto facility as part of its environmental program. In 2021, soil samples were taken from 34 locations and analyzed for uranium content. The samples were collected on the BWXT NEC Toronto site (table I‑20), on commercial lands (table I-21) located along the south border of the site, and in the nearby residential neighbourhood (table I-22). As a result of issues with access to Canadian Pacific Railway property, 33 previously sampled locations were not sampled and 18 alternate samples were taken at new locations in their place. In 2021, the measured soil concentrations of uranium ranged from <1.0 µg/g at a residential location to 4.6 µg/g on BWXT NEC property. Of the 34 samples taken, 33 had concentrations below Ontario’s background concentration of up to 2.5 µg/g Footnote 23 and well below the applicable CCME limit in the Canadian Soil Quality Guidelines for the Protection of Environmental and Human Health Footnote 19 for uranium for industrial, commercial and residential/parkland land use.
BWXT NEC conducted soil sampling for beryllium in 2020 around the Peterborough facility (table I-23) as committed to in the CNSC licence renewal hearing. In 2020, soil samples were taken from 21 locations that were selected for consistency with the CNSC’s IEMP. Soil sampling for beryllium and uranium (table I-24) was conducted by a third-party consultant at 13 locations in accordance with BWXT’s documented plan, which started in 2021, and is to be conducted annually. The minimum detectable concentration of uranium is 1.0 part per million (1.0 µg U/g). The samples were within the minimum detection limit of 1.0 µg/g. The minimum detectable concentration of beryllium is 0.5 parts per million (0.5 µg Be/g). Of the samples in which beryllium was detected, beryllium ranged between 0.5 µg/g to 0.52 µg/g. All samples fell well below Ontario’s background concentrations of up to 2.5 µg/g and well below the applicable CCME soil quality guideline for the protection of environmental health (4 mg/kg) and human health (75 mg/kg) Footnote 19.
| Parameter | 2017 | 2018 | 2019 | 2020 | 2021 | CCME guideline* |
|---|---|---|---|---|---|---|
| Average uranium concentration | 1.7 | 1.3 | 1.2 | 1.3 | 2.4 | 300 |
µg/g = microgram per gram; CCME= Canadian Council of Ministers of the Environment
*CCME, Canadian Soil Quality Guidelines for the Protection of Environmental and Human Health Footnote 19
| Parameter | 2017 | 2018 | 2019 | 2020 | 2021 | CCME guideline* |
|---|---|---|---|---|---|---|
| Average uranium concentration | 3.0 | 2.3 | 1.5 | 2.9 | 1.0 | 33 |
| Maximum uranium concentration | 20.6 | 11.9 | 2.8 | 17.6 | 1.0 | 33 |
µg/g = microgram per gram; CCME = Canadian Council of Ministers of the Environment
*CCME, Canadian Soil Quality Guidelines for the Protection of Environmental and Human Health Footnote 19
| Parameter | 2017 | 2018 | 2019 | 2020 | 2021 | CCME guideline* |
|---|---|---|---|---|---|---|
| Average uranium concentration | 1.0 | < 1.0 | 1.1 | 1.0 | 1.0 | 23 |
| Maximum uranium concentration | 1.6 | < 1.0 | 1.7 | 1.0 | 1.1 | 23 |
µg/g = microgram per gram; CCME = Canadian Council of Ministers of the Environment
*CCME, Canadian Soil Quality Guidelines for the Protection of Environmental and Human Health Footnote 19
| Parameter | 2020 | 2021 | CCME guideline* |
|---|---|---|---|
| Average beryllium concentration | 0.50 | 0.50 | 4.0 |
| Maximum beryllium concentration | 0.52 | 0.52 | 4.0 |
 µg/g = microgram per gram; CCME = Canadian Council of Ministers of the Environment
*CCME, Canadian Soil Quality Guidelines for the Protection of Environmental and Human Health Footnote 19
| Parameter | 2021 | CCME guideline* |
|---|---|---|
| Average uranium concentration | 1.0 | 23 |
| Maximum uranium concentration | 1.0 | 23 |
µg/g = microgram per gram; CCME = Canadian Council of Ministers of the Environment
*CCME, Canadian Soil Quality Guidelines for the Protection of Environmental and Human Health Footnote 19
Gamma monitoring
A portion of radiological public dose from the BWXT NEC Toronto and Peterborough facilities is due to gamma radiation sources. Consequently, it is necessary to monitor gamma radiation effective dose rates at the fenceline of the Toronto site and at the boundary of the Peterborough facility to ensure that levels of potential gamma radiation exposure are maintained ALARA.
In 2021, the annual radiation doses from direct gamma radiation were as follows:
- BWXT Toronto site measured 17.2 µSv
- BWXT Peterborough site measured 0.0 µSv (rounded-up value)
These measurements indicate that gamma dose from both BWXT NEC facilities are controlled and fall well below the 1 mSv (1,000 µSv) per year effective dose limit to a member of the public.
BWXT Medical
Atmospheric emissions
BWXT Medical performs weekly air exhaust stack sampling and continuously monitors process ventilation, exhaust ductwork, and stack emissions using in situ detectors, samplers, and computerized recording. BWXT Medical reported that there were no detectable airborne nuclear substances released to the environment from its facility in 2021 and that its non-radiological, hazardous substances emissions were well below the limits in its environmental compliance approval from the MECP
Liquid effluent
BWXT Medical collects wastewater in underground delay tanks and analyzes it before discharging into the sanitary sewer system.
In 2021, authorized radioactive liquid effluent releases from BWXT Medical remained well below the regulatory limits.
Soil sampling
In 2021, soil was sampled around the BWXT Medical facility, and there were no gamma-emitting radionuclides detected in the samples.
Environmental TLD program
Gamma radiation from the facility is monitored by BWXT Medical using environmental TLDs. The 2021 annual monitoring results show gamma radiation levels at offsite monitoring locations were in the range of natural background, which indicates that BWXT Medical’s operations are not contributing to the public’s gamma radiation exposure.
SRB Technologies (Canada) Inc.
Atmospheric emissions
SRBT monitors tritium releases from the facility stacks and reports the monitoring data on an annual basis. The monitoring data for 2017 to 2021 is provided in table I-25 and demonstrates that atmospheric emissions from the facility remained well below their regulatory limits
| Parameter | 2017 | 2018 | 2019 | 2020 | 2021 | Licence limit |
|---|---|---|---|---|---|---|
| Tritium as HTO | 7,198 | 10,741 | 11,858 | 9,755 | 8,387 | 67,200 |
| Total tritium as HTO + HT | 24,822 | 33,180 | 31,769 | 25,186 | 28,729 | 448,000 |
GBq = gigabecquerel; HTO = hydrogenated tritium oxide; HT = tritium gas
Liquid effluent
SRBT continues to control and monitor tritium released as liquid effluent from the facility. The monitoring data for 2017 to 2021 is provided in table I-26 and demonstrates that liquid effluent from the facility remained well below regulatory limits.
| Parameter | 2017 | 2018 | 2019 | 2020 | 2021 | Licence limit |
|---|---|---|---|---|---|---|
| Tritium – water soluble | 6.85 | 10.02 | 13.67 | 5.56 | 2.07 | 200 |
GBq = gigabecquerel
Tritium in ambient air
SRBT maintains 40 passive air samplers to monitor tritium in air, 35 of which are located within a 250 m to 2 km radius of the facility. These samplers represent tritium exposure pathways for inhalation and skin absorption and are used to calculate public dose. The 2021 air monitoring results from these samplers demonstrated that tritium levels in ambient air near SRBT remain low.
Groundwater monitoring
SRBT is in compliance with CSA N288.7-15, Groundwater Protection Programs at Class I Nuclear Facilities and Uranium Mines and Mills Footnote 16.
Groundwater is currently sampled at 32 groundwater monitoring wells and 5 residential drinking water wells. Sampling wells are used to establish tritium concentrations in the groundwater at various depths and in differing geologic strata. From the 2021 sampling results, the highest tritium concentration was reported for monitoring well MW06-10 (41,210 Bq/L). This well is located directly beneath the area where the active ventilation stacks are located. It is a dedicated, engineered groundwater monitoring well very near to the facility within a secured area and is not available to be used as a source of water consumption.
The elevated tritium concentrations in this well are from historical practices before 2006. SRBT continues to minimize tritium emissions during operations. As a result, tritium concentrations in the groundwater continue to show a declining trend, as illustrated in figure I-1.
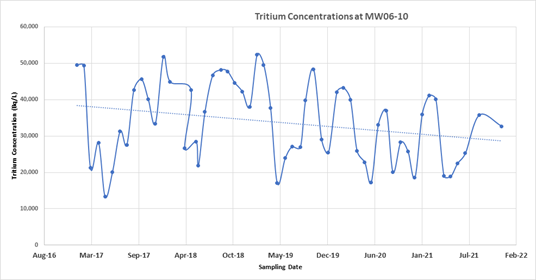
Throughout 2021, no other wells exceeded the Canadian drinking water guideline for tritium of 7,000 Bq/L Footnote 22.
Of the 5 nearby residential wells around the site, none are in the groundwater flow pathway. The closest one, RW-2, is 1,100 metres away from SRBT. The maximum tritium concentration among all of the sampled residential wells monitored was 44 Bq/L in 2021.
The total inventory of tritium in the groundwater around SRBT is also showing a declining trend, as illustrated in figure I-2, which shows the average tritium concentrations among all the groundwater monitoring wells around the site in the past 5 years (2017–21).
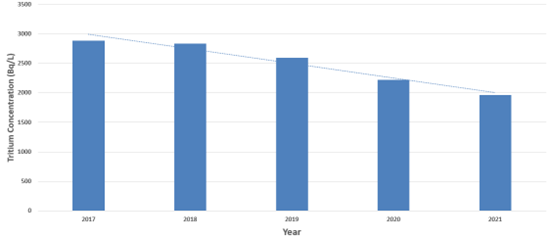
Other monitoring
SRBT samples and analyzes runoff water from its facility and engages a qualified third party to perform monitoring and analysis of precipitation, surface water, produce and milk. The 2021 monitoring data for these items shows that tritium concentrations continue to be low. This monitoring complements the principal monitoring activities that focus on air and groundwater
Nordion (Canada) Inc.
Atmospheric emissions
Nordion controls and monitors radioactive material releases from its facility to prevent unnecessary releases of radioisotopes to the atmosphere. Table I-27 provides Nordion’s radioactive air emissions monitoring results from 2017 to 2021.
The 2021 monitoring data demonstrates that radioactive air emissions from the facility remained below the regulatory limits. In November 2016, Nordion ceased production of molybdenum-99, iodine-125, iodine-131 and xenon-133, which resulted in zero releases of these isotopes from the facility in 2021. In 2021, there was a very small detectable amount of Co-60 released to the air.
| Parameter | 2017 | 2018 | 2019 | 2020 | 2021 | DRL |
|---|---|---|---|---|---|---|
| Cobalt-60 | 0.0034 | 0.002 | 0.00002 | 0 | 0.00004 | 250 |
| Iodine-125 | 0.0012 | 0 | 0 | 0 | 0 | 952 |
| Iodine-131 | 0.0008 | 0.006 | 0 | 0 | 0 | 686 |
| Xenon-133 | 0 | 0 | 0 | 0 | 0 | 677 million |
| Xenon-135 | 0 | 0 | 0 | 0 | 0 | 102 million |
| Xenon-135m | 0 | 0 | 0 | 0 | 0 | 69 million |
DRL = derived release limit; GBq = gigabecquerel
Liquid effluent
Nordion collects liquid effluent in delay tanks and analyzes it before discharging into the sanitary sewer system.
Table I-28 below provides Nordion’s monitoring results for radioactive liquid emissions from 2017 to 2021. The monitoring data demonstrates that authorized radioactive liquid effluent releases from the facility in 2021 remained below the regulatory limits.
In 2021, Nordion reported 4 environmental limit exceedances involving non-radiological releases to the sanitary sewer, which resulted in City of Ottawa Sewer Use by-law exceedances of nonylphenol ethoxylates, phosphorous, and suspended solids, and which were attributed to increased cleaning onsite due to COVID-19 and construction activities. This was identified by Nordion during routine sampling and was self-reported to the City of Ottawa. In addition, there was an R-22 refrigerant (halocarbon) release in 2021, although, during an investigation, the contractor could not find a direct cause for the leak and suspected it was more likely due to previous servicing or undercharging at the time of manufacture (see section 7.1 for details). CNSC staff conclude that these exceedances did not pose undue risk to the environment or human health.
| Parameter | 2017 | 2018 | 2019 | 2020 | 2021 | DRL |
|---|---|---|---|---|---|---|
| β < 1 MeV | 0.212 | 0.243 | 0.162 | 0.226 | N/A | 763 |
| β > 1 MeV | 0.048 | 0.055 | 0.038 | 0.057 | N/A | 35,000 |
| Iodine-125 | 0.145 | 0.146 | 0.063 | N/A | N/A | 1,190 |
| Iodine-131 | 0.006 | 0.007 | 0.004 | N/A | N/A | 389 |
| Molybdenum-99 | 0.049 | 0.055 | 0.036 | N/A | N/A | 10,200 |
| Cobalt-60 | 0.022 | 0.027 | 0.020 | 0.031 | 0.0046 | 35.4 |
| Niobium-95 | 0.0010 | 0.0010 | 0.002 | 0.0015 | 0.002 | 3,250 |
| Zirconium-95 | 0.0020 | 0.0017 | 0.0019 | 0.0013 | 0.002 | 2,060 |
| Cesium-137 | 0.0007 | 0.0007 | 0.0007 | 0.00076 | 0.001 | 24.8 |
β < 1 MeV = beta particles less than 1 megaelectronvolt; GBq = gigabecquerel; DRL = derived release limit
Groundwater monitoring
There are currently 9 groundwater monitoring wells on the Nordion site. Since 2005, Nordion has been monitoring groundwater at least once a year for non-radioactive contaminants in 4 monitoring wells. The monitoring results from 2017 to 2021 demonstrate that there were no significant changes in the groundwater in 2021 compared to previous years.
Since 2014, Nordion has been monitoring groundwater at least once a year for radioactive contaminants in 5 monitoring wells. The results since then have detected only naturally occurring radionuclides that are not processed at the Nordion facility.
These results, which are either below detection limits or at natural background levels, indicate that releases of radioactive and hazardous substances from Nordion’s facility have had no measurable impact on groundwater quality.
Soil sampling
Nordion conducted an annual soil sampling campaign around the facility in 2021, and no radionuclides attributable to licensed activities were detected in the soil samples.
Environmental TLD program
Nordion uses TLDs to monitor environmental gamma radiation from the facility. These devices are placed at locations that cover the points of a compass and are preferentially placed east of the facility to receive prevailing winds. Dosimeters are also placed in the residences of Nordion employees located near the facility. The 2021 annual monitoring results show gamma radiation levels at offsite monitoring locations were in the range of natural background, which indicates that Nordion’s operations are not contributing to the public’s gamma radiation exposure.
Best Theratronics Ltd.
Effluent and emissions control (releases)
There are no radiological releases (liquid or airborne) from the BTL facility that require controls or monitoring since it uses radioactive sealed sources that are not produced onsite and do not result in any radioactive releases.
BTL safely manages hazardous liquid effluents from routine operations. They are collected, temporarily stored onsite, and regularly removed for disposal by a certified third-party contractor. Lubricating oil for onsite boring and milling machines is recovered and recirculated. Therefore, there are no hazardous waterborne releases into the environment requiring controls or effluent monitoring.
Hazardous airborne emissions from BTL are related to the exhausting of the lead pouring, paint booth, fire torching and sand blasting areas. Engineering controls, such as filters and ventilation, are in place to reduce or eliminate emissions generated during operations. As a result, BTL does not have an effluent monitoring program or an environmental monitoring program.
Assessment and monitoring
BTL does not conduct environmental monitoring around its facility as there are no radiological releases that require controls or monitoring. Hazardous airborne emissions pertain to exhausting associated with the lead pouring area. BTL submits a report on lead and its compounds to the National Pollutant Release Inventory, maintaining annual compliance with the Toxics Reduction Act. There were no environmental occurrences in 2021 to report.
J. Worker dose data
This appendix presents information on doses to NEWs and non-NEWs at UNSPFs.
Blind River Refinery
Figure J-1 provides the average and maximum effective doses for NEWs at BRR between 2017 and 2021. The maximum effective dose received by a NEW in 2021 was 9.3 mSv, which is approximately 19% of the CNSC’s regulatory effective dose limit of 50 mSv in a 1-year dosimetry period. Average and maximum effective doses over this 5-year period are reflective of the work activities at BRR and influenced by factors such as production levels and number of operating days. The average and maximum effective doses are consistent with previous years.
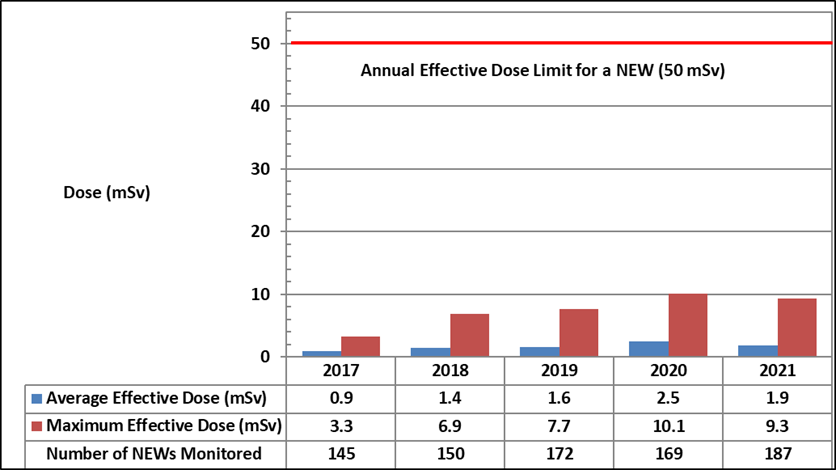
Description
| Dose statistic | 2017 | 2018 | 2019 | 2020 | 2021 |
|---|---|---|---|---|---|
| Average effective dose (mSv) | 0.9 | 1.4 | 1.6 | 2.5 | 1.9 |
| Maximum effective dose (mSv) | 3.3 | 6.9 | 7.7 | 10.1 | 9.3 |
| Number of nuclear energy workers monitored | 145 | 150 | 172 | 169 | 187 |
Note: The regulatory limit for effective dose to a nuclear energy worker is 50 mSv/year.
For the 5-year dosimetry period, which began on January 1, 2021, the maximum cumulative effective dose received by a NEW at BRR was 9.3 mSv. This effective dose result represents approximately 9% of the CNSC’s regulatory dose limit of 100 mSv in a 5-year dosimetry period.
Average and maximum equivalent dose results for skin and extremities (hands) of NEWs, from 2017 to 2021, are provided in tables J-1 and J-2. In 2021, the maximum individual skin dose received by a NEW at BRR was 39.9 mSv, which is approximately 8% of the CNSC’s regulatory equivalent dose limit of 500 mSv in a 1-year dosimetry period. The maximum individual extremity dose received by a NEW at BRR was 27.2 mSv, which is approximately 5% of the CNSC’s regulatory equivalent dose limit of 500 mSv in a 1-year dosimetry period.
| Dose data (mSv) | 2017 | 2018 | 2019 | 2020 | 2021 | Regulatory limit (mSv/year) |
|---|---|---|---|---|---|---|
| Average skin dose | 3.1 | 4.1 | 4.8 | 5.1 | 4.4 | N/A |
| Maximum individual skin dose | 16.2 | 28.4 | 29.2 | 39.1 | 39.9 | 500 |
mSv = millisievert; N/A = not applicable
| Dose data (mSv) | 2017 | 2018 | 2019 | 2020 | 2021 | Regulatory limit (mSv/year) |
|---|---|---|---|---|---|---|
| Average extremity dose | 1.0 | 3.5 | 3.9 | 3.4 | 5.2 | N/A |
| Maximum individual extremity dose | 13.6 | 14.5 | 11.9 | 14.5 | 27.2 | 500 |
mSv = millisievert; N/A = not applicable
At BRR, the uranium products have solubilities of types F, M and S. Cameco’s Fuel Services Division holds a CNSC dosimetry service licence, which authorizes Cameco to provide in-house internal dosimetry services to BRR. The lung counting program is used for assigning worker doses from routine monitoring assuming a chronic pattern of inhalation intakes of uranium products of types M and S. This is a conservative approach for workers exposed to a combination of chronic and acute (short-term) inhalation intakes. The urine analysis program assesses the dose from acute intakes of type F material and is also used for monitoring the toxic effects of uranium.
Workers are placed on either a bi-weekly or a monthly urine sampling schedule. Samples may be collected outside of the routine urine sampling schedule, such as when there is a suspected unplanned intake of uranium or following a specific work activity; these are referred to as non-routine samples. The urine analysis program includes graduated responses to increasing uranium concentrations in urine, with potential chemical toxicity of uranium to the kidneys considered.
At BRR, the following action levels for NEWs have been implemented:
- The action level for bi-weekly urine samples is 65 μg U/L, which is the concentration of uranium in urine that results in a potential dose of 1 mSv and represents the chemical toxicity reference limit of 3 µg U/g kidney tissue, assuming the intake occurred at the mid-point of the sampling period.
- The action level for monthly urine samples is 44 μg U/L, which is set at the concentration of uranium in urine that results in a potential dose of 1 mSv and represents the chemical toxicity reference limit of 3 µg U/g kidney tissue, assuming the intake occurred at the mid-point of the sampling period.
It is noted that the action levels are supported by additional radiation safety controls provided by BRR’s radiation protection program, including in-plant air monitoring conducted continuously in the production areas. Because of these precautions, a suspected intake of uranium product would not likely be detected initially through routine urine sampling alone.
In 2021, 4,192 urine samples were analyzed and no routine sample reached an action level. One non-routine sample above the administrative level was investigated in 2021, and it was determined to be well below the level that would impact kidney function.
Table J-3 provides the distribution of uranium in urine results from workers’ urine samples collected between 2017 and 2021.
| Parameters | 2017 | 2018 | 2019 | 2020 | 2021 |
|---|---|---|---|---|---|
| Total number of samples analyzed | 3,263 | 3,432 | 3,671 | 3,795 | 4,192 |
| Number of samples at or above the action level | 0 | 0 | 0 | 0 | 0 |
| Maximum routine sample result (µg U/L) | 6.5 | 12.5 | 20.5 | 15.7 | 14.0 |
| Maximum non-routine sample result (µg U/L) | 72 | 54 | 69 | 45 | 180 |
Non-NEWs at the BRR
Site visitors and contractors who are not considered NEWs are issued external dosimetry to monitor their radiological exposures while at BRR. In 2021, the maximum individual effective dose received by a site visitor or contactor who was not a NEW was 0.23 mSv, which is well below the CNSC’s regulatory effective dose limit of 1 mSv per calendar year for a non-NEW.
Port Hope Conversion Facility
Figure J-2 provides the average and maximum effective doses for NEWs at PHCF between 2017 and 2021. The maximum individual effective dose received by a NEW in 2021 was 6.6 mSv, which is approximately 13% of the CNSC’s regulatory effective dose limit of 50 mSv in a 1-year dosimetry period. The average and maximum total effective doses over this 5-year period have remained steady and are reflective of the work activities and production levels at PHCF.
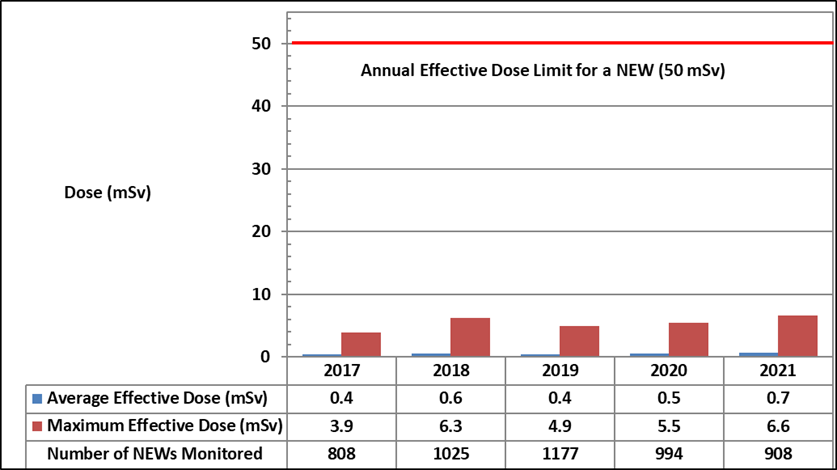
Description
| Dose statistic | 2017 | 2018 | 2019 | 2020 | 2021 |
|---|---|---|---|---|---|
| Average effective dose (mSv) | 0.4 | 0.6 | 0.4 | 0.5 | 0.7 |
| Maximum effective dose (mSv) | 3.9 | 6.3 | 4.9 | 5.5 | 6.6 |
| Number of nuclear energy workers monitored | 808 | 1,025 | 1,177 | 994 | 908 |
Note: The regulatory limit for effective dose to a nuclear energy worker is 50 mSv/year.
For the 5-year dosimetry period, which began on January 1, 2021, the maximum cumulative effective dose received by a NEW at PHCF was 6.6 mSv. This effective dose result represents approximately 7% of the CNSC’s regulatory dose limit of 100 mSv in a 5-year dosimetry period.
Average and maximum equivalent dose results for the skin of NEWs, from 2017 to 2021, are provided in table J-4. In 2021, the maximum individual skin dose received by a NEW at PHCF was 16.3 mSv, which is approximately 3% of the CNSC’s regulatory equivalent dose limit of 500 mSv in a 1-year dosimetry period. The average and maximum skin doses over this 5-year period have been relatively steady.
| Dose data (mSv) | 2017 | 2018 | 2019 | 2020 | 2021 | Regulatory limit (mSv/year) |
|---|---|---|---|---|---|---|
| Average skin dose | 0.6 | 0.7 | 0.5 | 0.5 | 0.7 | N/A |
| Maximum individual skin dose | 13.7 | 14.9 | 20.1 | 17.0 | 16.3 | 500 |
mSv = millisievert; N/A = not applicable
At PHCF, uranium products have solubilities of types F, M and S. Cameco’s Fuel Services Division holds a CNSC dosimetry service licence, which authorizes Cameco to provide in-house internal dosimetry services to PHCF. The lung counting program is used for assigning worker doses from routine monitoring assuming a chronic pattern of inhalation intakes of uranium products of types M and S. This is a conservative approach for workers exposed to a combination of chronic and acute (short-term) inhalation intakes. The urine analysis program primarily focuses on assessing the dose from acute intakes of type F material and is also used for monitoring the toxic effects of uranium.
The routine urine sampling frequency ranges from daily to monthly, depending on the work group. Samples may also be collected outside of the routine urine sampling schedule, such as when there is a suspected unplanned intake of uranium or following a specific work activity; these are referred to as post-shift (non-routine) urine samples. The urine analysis program includes graduated responses to increasing uranium concentrations in urine, with potential radiation doses and chemical toxicity of uranium to the kidneys considered.
At PHCF, the following action levels for NEWs have been implemented:
- The action level for bi-weekly urine samples is 65 μg U/L, which is the concentration of uranium in urine that results in a potential dose of 0.5 mSv and represents the chemical toxicity reference limit of 3 µg U/g kidney tissue, assuming the intake occurred at the mid-point of the sampling period.
- The action level for monthly urine samples is 25 μg U/L, which is set at the concentration of uranium in urine that results in a potential dose of 0.4 mSv and represents the chemical toxicity reference limit of 3 µg U/g kidney tissue, assuming the intake occurred at the mid-point of the sampling period.
- The action level for daily urine samples is 80 µg U/L, which is set at the concentration of uranium in urine that results in a potential dose of 0.10 mSv and represents a potential kidney burden of 0.98 µg U/g kidney tissue, assuming the intake occurred within 24 hours of the sample being taken.
- The action level for all post-shift (non-routine) urine samples, strictly for monitoring for potential kidney toxicity, is 500 µg U/L, which represents a potential kidney burden of 0.25 µg U/g kidney tissue, assuming the intake occurred within 12 hours of the sample being taken.
In addition, an action level of 40 µg U/L has been set for daily urine samples submitted by persons not considered as NEWs. This concentration of uranium in urine results in a potential dose of < 0.05 mSv and represents a potential kidney burden of 0.49 µg U/g kidney tissue, assuming the intake occurred within 24 hours of the sample being taken.
It is noted that the action levels are supported by additional radiation safety controls provided by the PHCF’s radiation protection program, including in-plant air monitoring conducted continuously in the production areas. As a result of these precautions, a suspected intake of uranium product would not likely be initially detected through routine urine sampling alone.
In 2021, 28,855 urine samples were analyzed, and no sample reached an action level.
Table J-5 provides the distribution of uranium in urine results from workers’ (NEWs and non-NEWs) urine samples collected between 2017 and 2021.
| Parameters | 2017 | 2018 | 2019 | 2020 | 2021 |
|---|---|---|---|---|---|
| Total number of samples analyzed | 27,650 | 34,900 | 44,952 | 28,761 | 28,855 |
| Number of samples at or above the action level | 0 | 0 | 0 | 0 | 0 |
| Maximum routine sample result (µg U/L) | 9.5 | 24 | 60 | 9.6 | 14 |
| Maximum non-routine sample result (µg U/L) | 250 | 160 | 400 | 390 | 120 |
Non-NEWs at PHCF
Cameco employees, site visitors and contractors whose work activities do not require NEW status may be issued whole-body dosimeters and may participate in the internal dosimetry program to monitor their radiological exposures while at PHCF. In 2021, the maximum individual effective dose received by a person who was not a NEW was 0.08 mSv, which is well below the CNSC’s regulatory effective dose limit of 1 mSv per calendar year for a non-NEW.
Cameco Fuel Manufacturing Inc.
Figure J-3 provides the average and maximum effective doses for NEWs at CFM between 2017 and 2021. The maximum individual effective dose received by a NEW in 2021 was 9.9 mSv, which is approximately 20% of the CNSC’s regulatory effective dose limit of 50 mSv in a 1-year dosimetry period. The average total effective doses over this 5-year period have remained steady. The maximum total effective dose in 2021 was higher than in previous years due to the internal dose assigned to a NEW as a result of the lung dose action level exceedance discussed in section 5.7.
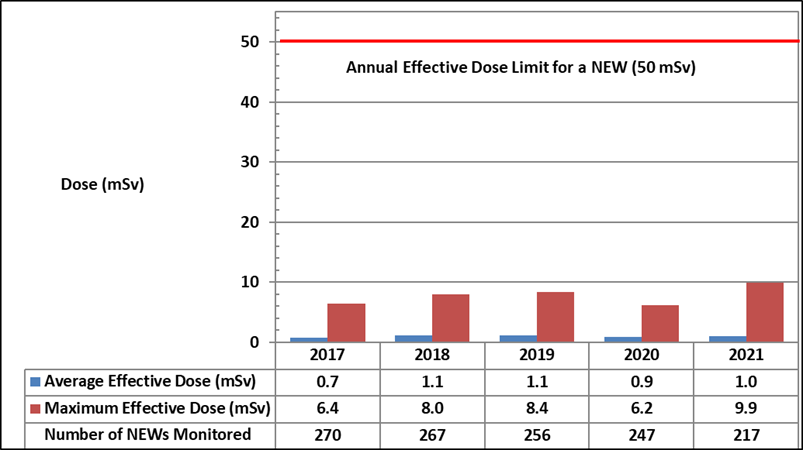
Description
| Dose statistic | 2017 | 2018 | 2019 | 2020 | 2021 |
|---|---|---|---|---|---|
| Average effective dose (mSv) | 0.7 | 1.1 | 1.1 | 0.9 | 1.0 |
| Maximum effective dose (mSv) | 6.4 | 8.0 | 8.4 | 6.2 | 9.9 |
| Number of nuclear energy workers monitored | 270 | 267 | 256 | 247 | 217 |
Note: The regulatory limit for effective dose to a nuclear energy worker is 50 mSv/year.
For the 5-year dosimetry period, which began on January 1, 2021, the maximum cumulative effective dose received by a NEW at CFM was 9.9 mSv. This effective dose result represents approximately 10% of the CNSC’s regulatory dose limit of 100 mSv in a 5-year dosimetry period.
Average and maximum equivalent dose results for the skin and extremities (hands) of NEWs, from 2017 to 2021, are provided in tables J-6 and J-7. In 2021, the maximum skin dose received by a NEW at CFM was 40.9 mSv, which is approximately 8% of the CNSC’s regulatory equivalent dose limit of 500 mSv in a 1-year dosimetry period. The maximum extremity dose received by a NEW at CFM was 41.9 mSv, which is approximately 8% of the CNSC’s regulatory equivalent dose limit of 500 mSv in a 1-year dosimetry period. The average and maximum equivalent doses to the skin have been steady or decreasing over this 5-year period. CFM attributes this trend, in part, to improvements made to work practices and work areas.
| Dose data (mSv) | 2017 | 2018 | 2019 | 2020 | 2021 | Regulatory limit (mSv/year) |
|---|---|---|---|---|---|---|
| Average skin dose | 5.5 | 3.4 | 3.1 | 3.1 | 3.5 | N/A |
| Maximum individual skin dose | 88.1 | 59.0 | 56.9 | 55.3 | 40.9 | 500 |
mSv = millisievert; N/A = not applicable
| Dose data (mSv) | 2017 | 2018 | 2019 | 2020 | 2021 | Regulatory limit (mSv/year) |
|---|---|---|---|---|---|---|
| Average extremity dose | 10.6 | 15.8 | 18.4 | 17.9 | 8.4 | N/A |
| Maximum individual extremity dose | 59.0 | 57.1 | 90.8 | 65.6 | 41.9 | 500 |
mSv = millisievert; N/A = not applicable
At CFM, the input to the pellet manufacturing process is ceramic-grade UO2. UO2 has a solubility of type S, which clears slowly from the body and has a retention time in the body of years. The lung counting program is used for assigning worker doses from routine monitoring, assuming a chronic pattern of inhalation intakes. This is a conservative approach for workers exposed to a combination of chronic and acute (short-term) inhalation intakes. Cameco’s Fuel Services Division holds a CNSC dosimetry service licence, which authorizes Cameco to provide in-house internal dosimetry services to CFM. Since 2014, internal dose is assessed and assigned at CFM through the CNSC-licensed lung counting program.
To complement the lung counting program, routine bi-weekly urine samples are collected from workers for monitoring of acute inhalation or accidental ingestion of UO2. Samples may be collected outside of the routine urine sampling schedule, such as following non-routine work or an elevated air monitoring result in a work area. The urine analysis program at CFM includes graduated responses to increasing uranium concentrations in urine. Cameco has developed tables of urine excretion rates for various monitoring intervals and corresponding concentration levels for uranium compounds, which may indicate that the chemical toxicity reference limit of 3 µg U/g of kidney tissue has been exceeded.
At CFM, an action level of 10 µg U/L is implemented for all urine samples. This translates to a range of 0.008 to 0.435 µg U/g of kidney tissue, well below the chemical toxicity reference limit of 3 µg U/g of kidney tissue.
In 2021, 1,565 urine samples were analyzed, and no sample reached the action level.
Table J-8 provides the urine analysis results for NEWs at CFM from 2017 to 2021. As shown, no urine analysis samples exceeded CFM’s action level during this period.
| Parameters | 2017 | 2018 | 2019 | 2020 | 2021 |
|---|---|---|---|---|---|
| Total number of samples analyzed | 1,819 | 1,799 | 1,689 | 1,685 | 1,565 |
| Number of samples at or above the action level | 0 | 0 | 0 | 0 | 0 |
| Maximum sample result (µg U/L) | 2.4 | 4.8 | 3.1 | 2.0 | 1.5 |
Non-NEWs at CFM
Visitors and contractors who are not considered NEWs are issued dosimeters to monitor their radiological exposures while at CFM. In 2021, there were no measurable doses recorded on dosimeters issued to non-NEWs.
BWXT Nuclear Energy Canada Inc. Toronto and Peterborough
Figure J-4 provides the average and maximum effective doses for NEWs at BWXT NEC’s Peterborough facility between 2017 and 2021. The maximum effective dose received by a NEW in 2021 at the Peterborough facility was 9.8 mSv, or approximately 20% of the CNSC’s regulatory effective dose limit of 50 mSv in a 1-year dosimetry period.
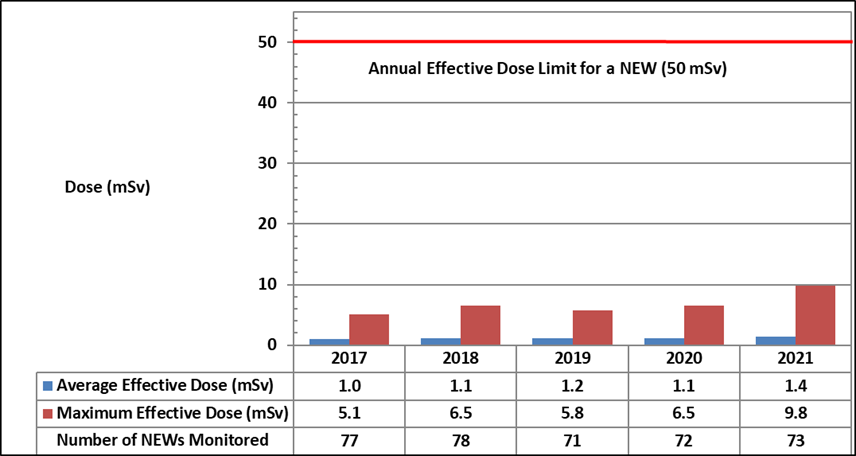
Description
| Dose statistic | 2017 | 2018 | 2019 | 2020 | 2021 |
|---|---|---|---|---|---|
| Average effective dose (mSv) | 1.0 | 1.1 | 1.2 | 1.1 | 1.4 |
| Maximum effective dose (mSv) | 5.1 | 6.5 | 5.8 | 6.5 | 9.8 |
| Number of nuclear energy workers monitored | 77 | 78 | 71 | 72 | 73 |
Note: The regulatory limit for effective dose to a nuclear energy worker is 50 mSv/year.
The maximum individual effective dose for a NEW at the Peterborough facility for the 5‑year dosimetry period, which began on January 1, 2021, was 9.8 mSv, or approximately 9.8% of the CNSC’s regulatory effective dose limit of 100 mSv in a 5-year dosimetry period.
Figure J-5 provides the average and maximum effective doses for NEWs at BWXT NEC’s Toronto facility between 2017 and 2021. The maximum effective dose received by a NEW in 2021 at the Toronto facility was 5.7 mSv, or approximately 11% of the CNSC’s regulatory effective dose limit of 50 mSv in a 1-year dosimetry period.
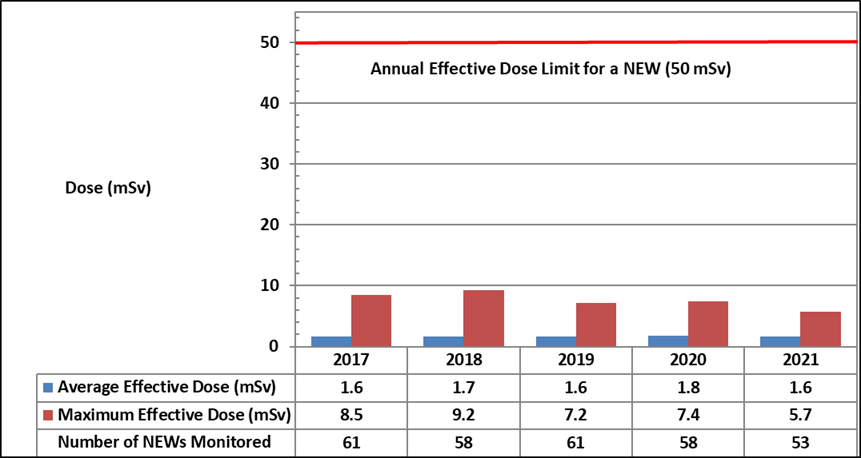
Description
| Dose statistic | 2017 | 2018 | 2019 | 2020 | 2021 |
|---|---|---|---|---|---|
| Average effective dose (mSv) | 1.6 | 1.7 | 1.6 | 1.8 | 1.6 |
| Maximum effective dose (mSv) | 8.5 | 9.2 | 7.2 | 7.4 | 5.7 |
| Number of nuclear energy workers monitored | 61 | 58 | 61 | 58 | 53 |
Note: The regulatory limit for effective dose to a nuclear energy worker is 50 mSv/year.
The maximum individual effective dose for a NEW at the Toronto facility for the 5-year dosimetry period, which began on January 1, 2021, was 5.7 mSv, or approximately 5.7% of the CNSC’s regulatory effective dose limit of 100 mSv in a 5-year dosimetry period.
Annual average and maximum equivalent doses to the skin and extremities (hands) of NEWs from 2017 to 2021 are provided in tables J-9 through J-12.
In 2021, the maximum individual equivalent skin dose was 30.9 mSv at the Peterborough facility and 37.2 mSv at the Toronto facility.
| Dose data (mSv) | 2017 | 2018 | 2019 | 2020 | 2021 | Regulatory limit (mSv/year) |
|---|---|---|---|---|---|---|
| Average skin dose | 2.8 | 2.9 | 3.0 | 2.8 | 3.6 | N/A |
| Maximum individual skin dose | 25.1 | 17.9 | 17.4 | 19.0 | 30.9 | 500 |
mSv = millisievert; N/A = not applicable
| Dose data (mSv) | 2017 | 2018 | 2019 | 2020 | 2021 | Regulatory limit (mSv/year) |
|---|---|---|---|---|---|---|
| Average skin dose | 7.9 | 8.9 | 8.1 | 8.9 | 7.9 | N/A |
| Maximum individual skin dose | 54.3 | 58.4 | 39.8 | 39.1 | 37.2 | 500 |
mSv = millisievert; N/A = not applicable
In 2021, the maximum individual equivalent extremity dose was 59.0 mSv at the Peterborough facility and 66.1 mSv at the Toronto facility.
| Dose data  (mSv) | 2017 | 2018 | 2019 | 2020 | 2021 | Regulatory limit (mSv/year) |
|---|---|---|---|---|---|---|
| Average extremity dose | 13.6 | 14.3 | 11.3 | 18.8 | 23.7 | N/A |
| Maximum individual extremity dose | 43.2 | 46.1 | 29.4 | 43.2 | 59.0 | 500 |
mSv = millisievert; N/A = not applicable
| Dose data (mSv) | 2017 | 2018 | 2019 | 2020 | 2021 | Regulatory limit (mSv/year) |
|---|---|---|---|---|---|---|
| Average extremity dose | 27.4 | 24.6 | 20.7 | 25.4 | 22.2 | N/A |
| Maximum individual extremity dose | 115.1 | 83.3 | 79.7 | 115.5 | 66.1 | 500 |
mSv = millisievert; N/A = not applicable
Across the 2 facilities, the maximum individual equivalent doses to the skin and the extremities were received by NEWs at the Toronto facility and were approximately 7% and 13% (respectively) of the CNSC’s regulatory equivalent dose limit of 500 mSv in a 1-year dosimetry period. Over the past 5 years, average equivalent extremity and skin doses have been relatively stable at both facilities. The reason for the consistently lower skin and extremity doses at the Peterborough facility is the low likelihood of direct pellet handling by workers, as opposed to the Toronto facility where this practice is a necessary part of the process. At the Peterborough facility, except in the end-cap welding station, all pellets are shielded in zirconium tubes, bundles or boxes.
BWXT’s facilities handle ceramic-grade UO2. UO2 has a solubility of type S and clears slowly from the body, with a retention time in the body of years. The measurement of uranium in urine is used as a screening method for assessing whether inhalation of airborne UO2 or accidental ingestion has occurred. Urine analysis is used as a screening tool to initiate further review of internal dose control measures and practices but is not used to estimate internal dose. Internal dose is estimated based on workstation air monitoring. At the Toronto facility, workers are placed on a routine weekly or monthly urine sampling schedule. Workers at the Peterborough facility are on a routine quarterly urine sampling schedule. Samples may be collected outside of the routine urine sampling schedules, such as following non-routine work or an elevated air monitoring result in a work area.
An action level of 10 µg U/L is implemented for all urine samples. This translates to a range of 0.008 to 0.3 µg U/g of kidney tissue at BWXT Toronto, and a range of 0.008 to 0.732 µg U/g of kidney tissue at BWXT Peterborough, well below the chemical toxicity reference limit of 3 µg U/g of kidney tissue.
If a urine sample result is at or above an action level, a formal investigation ensues, which includes follow-up urine sampling and the worker being referred for lung counting, if warranted. The CNSC must also be notified as per regulatory requirements.
At BWXT Toronto in 2021, 1,499 urine samples were analyzed, and no sample reached the action level.
Table J-13 provides the distribution of uranium in urine results from workers’ urine samples collected between 2017 and 2021 at BWXT Toronto.
| Parameters | 2017 | 2018 | 2019 | 2020 | 2021 |
|---|---|---|---|---|---|
| Total number of samples analyzed | 1,621 | 1,600 | 1,594 | 1,646 | 1,499 |
| Number of samples at or above the action level | 0 | 0 | 0 | 0 | 0 |
| Maximum sample result (µg U/L) | 4.9 | 3.5 | 3.8 | 4.0 | 2.7 |
At BWXT Peterborough in 2021, 103 urine samples were analyzed, and no sample reached the action level.
Table J-14 provides the distribution of uranium in urine results from workers’ urine samples collected between 2017 and 2021 at BWXT Peterborough.
| Parameters | 2017 | 2018 | 2019 | 2020 | 2021 |
|---|---|---|---|---|---|
| Total number of samples analyzed | 99 | 108 | 88 | 86 | 103 |
| Number of samples at or above the action level | 0 | 0 | 0 | 0 | 0 |
| Maximum sample result (µg U/L) | < 0.1 | < 0.1 | 0.1 | 0.4 | 0.1 |
Non-NEWs at BWXT NEC
For both the Peterborough and Toronto facilities, visitors and contractors are all considered non-NEWs and are not directly monitored. Doses are estimated based on in-plant radiological conditions and occupancy factors to ensure that radiation doses are controlled well below the CNSC’s regulatory effective dose limit of 1 mSv per calendar year for a non‑NEW.
SRB Technologies (Canada) Inc.
Figure J-6 provides the average and maximum effective doses for NEWs at SRBT from 2017 to 2021. The maximum effective dose received by a NEW in 2021 was 0.36 mSv, which is less than 1% of the CNSC’s regulatory effective dose limit of 50 mSv in a 1-year dosimetry period. The average effective dose decreased in 2021.
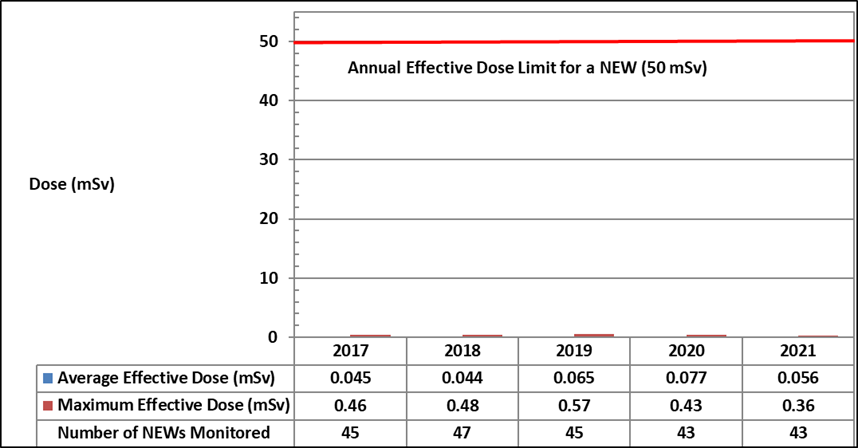
Description
| Dose statistic | 2017 | 2018 | 2019 | 2020 | 2021 |
|---|---|---|---|---|---|
| Average effective dose (mSv) | 0.045 | 0.044 | 0.065 | 0.077 | 0.056 |
| Maximum effective dose (mSv) | 0.46 | 0.48 | 0.57 | 0.43 | 0.36 |
| Number of nuclear energy workers monitored | 45 | 47 | 45 | 43 | 43 |
Note: The regulatory limit for effective dose to a nuclear energy worker is 50 mSv/year.
The maximum individual effective dose for a NEW at SRBT for the 5-year dosimetry period, which began on January 1, 2021, was 0.36 mSv, or approximately 0.4% of the CNSC’s regulatory effective dose limit of 100 mSv in a 5-year dosimetry period.
Given the uniform distribution of tritium in body tissues, equivalent skin doses are essentially the same as the effective whole-body dose provided in figure J-6, and are therefore not reported separately. For this same reason, extremity doses are not separately monitored for workers at SRBT.
Non-NEWs at SRBT
While contractors are not identified as NEWs because they do not perform radiological work, their radiological exposures are monitored while they are at the SRBT facility to ensure that their doses remain ALARA and below the CNSC’s regulatory dose limit of 1 mSv per calendar year for a non-NEW. In 2021, no contractors received a recordable dose that resulted from work activities performed at the facility.
Nordion (Canada) Inc.
Figure J-7 provides the average and maximum effective doses to NEWs at Nordion from 2017 to 2021. In 2018, Nordion sold its medical isotope business to BWXT Medical, which operated as a contractor until receiving its own licence in November 2021. The Co-60 operations drove the maximum doses, so the trending there is consistent. The average effective dose increased in 2021 as the lower doses from the medical isotope operation were no longer included. Nordion reported that the maximum effective dose received by a NEW in 2021 was 4.3 mSv, approximately 8.6% of the CNSC’s regulatory effective dose limit of 50 mSv in a 1-year dosimetry period. Average and maximum effective doses have been relatively stable between 2017 and 2021.
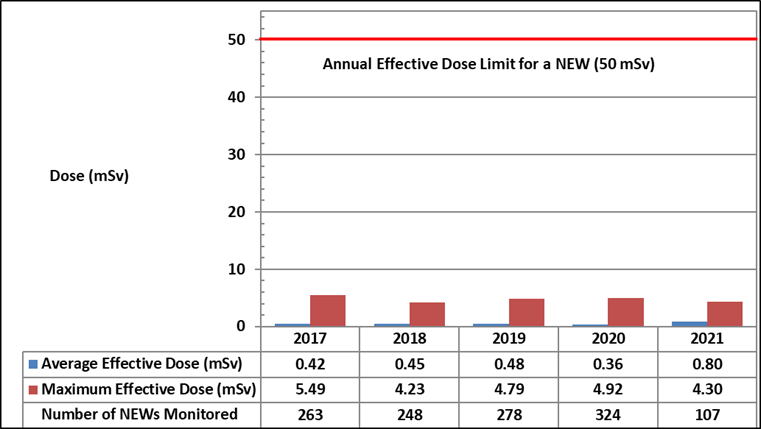
Description
| Dose statistic | 2017 | 2018 | 2019 | 2020 | 2021 |
|---|---|---|---|---|---|
| Average effective dose (mSv) | 0.42 | 0.45 | 0.48 | 0.36 | 0.80 |
| Maximum effective dose (mSv) | 5.49 | 4.23 | 4.79 | 4.92 | 4.30 |
| Number of nuclear energy workers monitored | 263 | 248 | 278 | 324 | 107 |
Note: The regulatory limit for effective dose to a nuclear energy worker is 50 mSv/year.
The maximum individual effective dose for a NEW at Nordion for the 5-year dosimetry period, which began on January 1, 2021, was 4.30 mSv, or approximately 4% of the CNSC’s regulatory effective dose limit of 100 mSv in a 5-year dosimetry period.
As the only isotope now used at Nordion is Co-60, the equivalent doses to the skin are deemed equal to the effective doses found above in figure J-7.
Annual average and maximum equivalent doses to the extremities (hands) of NEWs from 2017 to 2021 are provided in table J-15. In 2021, the maximum equivalent extremity dose for a NEW in the active area was 7.73 mSv. This dose represents approximately 1.5% of the CNSC’s regulatory equivalent dose limit of 500 mSv in a 1-year dosimetry period.
| Dose data (mSv) | 2017 | 2018 | 2019 | 2020 | 2021 | Regulatory limit (mSv/year) |
|---|---|---|---|---|---|---|
| Average extremity dose | 0.53 | 0.96 | 1.14 | 0.93 | 1.56 | N/A |
| Maximum individual extremity dose | 16.40 | 9.08 | 20.93 | 16.48 | 7.73 | 500 |
mSv = millisievert; N/A = not applicable
Non-NEWs at Nordion
At Nordion, there may be occasions where workers who are classified as non-NEWs enter the active area but do not perform any radiological work. Nordion monitors non-NEWs as required and provides relevant training to ensure that their doses are kept ALARA. In 2021, Nordion monitored 53 non-NEWs, with a maximum effective dose of 0.30 mSv, which is well below the CNSC’s regulatory effective dose limit of 1 mSv per calendar year for a non- NEW. The average effective dose for non-NEWs in 2021 was 0.04 mSv.
Best Theratronics Ltd
At BTL, employees are classified as NEWs if they are expected to have a reasonable probability of receiving an annual occupational dose greater than 1 mSv. Figure J-8 provides the average and maximum effective doses for NEWs at BTL between 2017 and 2021. In 2021, the maximum effective dose received by a NEW at BTL was 0.13 mSv, or approximately 0.3% of the CNSC’s regulatory effective dose limit of 50 mSv in a 1-year dosimetry period. Over the past 5 years, annual effective doses at BTL have remained stable and very low, with slight variations due to production volumes.
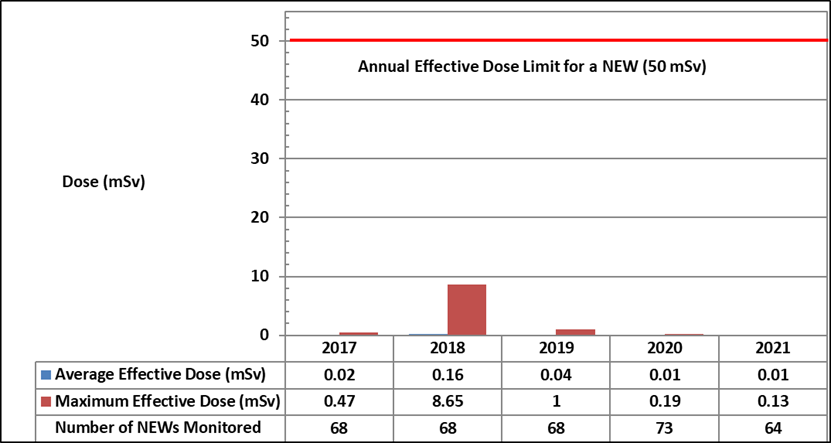
Description
| Dose statistic | 2017 | 2018 | 2019 | 2020 | 2021 |
|---|---|---|---|---|---|
| Average effective dose (mSv) | 0.02 | 0.16 | 0.04 | 0.01 | 0.01 |
| Maximum effective dose (mSv) | 0.47 | 8.65 | 1.00 | 0.19 | 0.13 |
| Number of nuclear energy workers monitored | 68 | 68 | 68 | 73 | 64 |
Note: The regulatory limit for effective dose to a nuclear energy worker is 50 mSv/year.
The maximum individual effective dose for a NEW at BTL for the 5-year dosimetry period, which began on January 1, 2021, was 0.13 mSv, or approximately 0.13% of the CNSC’s regulatory effective dose limit of 100 mSv in a 5-year dosimetry period.
The higher-than-normal maximum effective and equivalent doses (skin and hands) in 2018 were due to an unplanned upset condition that resulted in an action level exceedance.
Annual average and maximum equivalent doses to the extremities (hands) of NEWs from 2017 to 2021 are provided in table J-16. The maximum equivalent extremity dose for a NEW in 2021 was 0.47 mSv, which is approximately 0.09% of the CNSC’s regulatory equivalent dose limit of 500 mSv in a 1-year dosimetry period. Except for the 2018 action level exceedance, over the past 5 years, average equivalent doses to the extremities have remained very low.
| Dose data (mSv) | 2017 | 2018 | 2019 | 2020 | 2021 | Regulatory limit (mSv/year) |
|---|---|---|---|---|---|---|
| Average extremity dose | 0.07 | 1.41 | 0.22 | 0.15 | 0.06 | N/A |
| Maximum individual extremity dose | 0.5 | 13.51 | 2.51 | 2.4 | 0.47 | 500 |
mSv = millisievert; N/A = not applicable
The equivalent doses to the skin of NEWs are equal to the effective doses due to the nature of exposure, as provided in figure J-8.
Non-NEWs at BTL
BTL workers identified as non-NEWs, such as administrative staff, are not permitted in controlled areas and are therefore not occupationally exposed to radiation.
BWXT Medical
BWXT Medical took over the medical isotope facility at Nordion as a contractor in 2018. In November 2021, BWXT Medical received its own licence to perform this work. At BWXT Medical, employees are classified as NEWs if they are expected to have a reasonable probability of receiving an annual effective dose greater than 1 mSv. In 2021, the maximum effective dose received by a NEW at BWXT Medical was 2.41 mSv, or approximately 4.8% of the CNSC’s regulatory effective dose limit of 50 mSv in a 1-year dosimetry period and 2.4% of the CNSC’s regulatory effective dose limit of 100 mSv in a 5-year dosimetry period. The average effective dose was 0.15 mSv.
Annual average and maximum equivalent dose results for skin and extremities (hands) of NEWs in 2021 are provided in tables J-17 and J-18. The maximum equivalent skin dose for 2021 was 2.44 mSv, and the maximum equivalent extremity dose for a worker in the active area was 12.58 mSv. These doses represent approximately 0.5% and 2.5%, respectively, of the CNSC’s regulatory equivalent dose limits of 500 mSv in a 1-year dosimetry period.
| Dose data (mSv) | 2017 | 2018 | 2019 | 2020 | 2021 | Regulatory limit (mSv/year) |
|---|---|---|---|---|---|---|
| Average skin dose | N/A | N/A | N/A | N/A | 0.15 | N/A |
| Maximum individual skin dose | N/A | N/A | N/A | N/A | 2.44 | 500 |
mSv = millisievert; N/A = not applicable
| Dose data (mSv) | 2017 | 2018 | 2019 | 2020 | 2021 | Regulatory limit (mSv/year) |
|---|---|---|---|---|---|---|
| Average extremity dose | N/A | N/A | N/A | N/A | 0.56 | N/A |
| Maximum individual extremity dose | N/A | N/A | N/A | N/A | 12.58 | 500 |
mSv = millisievert; N/A = not applicable
Non-NEWs at BWXT Medical
At BWXT Medical, all contractors are classified as non-NEWS. BWXT Medical monitors non-NEWs as required and provides relevant training to ensure that their doses are kept ALARA. In 2021, 249 non-NEWs (including contractors and employees) were monitored. This large number of contractors is due to construction activities in the medical isotope facility. BWXT Medical reported that the maximum effective dose received by a non-NEW was 0.47 mSv, which is 47% of the CNSC’s regulatory effective dose limit of 1 mSv per calendar year for a non-NEW. The average effective dose for non-NEWs in 2021 was 0.03 mSv.
K. Health and safety data
| Facility | Statistic | 2017 | 2018 | 2019 | 2020 | 2021 |
|---|---|---|---|---|---|---|
| BRR | LTI 9 | 0 | 0 | 0 | 0 | 0 |
| BRR | Severity rate 10 | 0 | 0 | 0 | 0 | 0 |
| BRR | Frequency rate 11 | 0 | 0 | 0 | 0 | 0 |
| PHCF | LTI | 1 | 2 | 0 | 0 | 0 |
| PHCF | Severity rate | 1.67 | 7.58 | 0 | 0 | 0 |
| PHCF | Frequency rate | 0.28 | 0.49 | 0 | 0 | 0 |
| CFM | LTI | 0 | 0 | 0 | 0 | 0 |
| CFM | Severity rate | 0 | 0 | 0 | 0 | 0 |
| CFM | Frequency rate | 0 | 0 | 0 | 0 | 0 |
| BWXT NEC | LTI | 0 | 0 | 0 | 0 | 1 |
| BWXT NEC | Severity rate | 0 | 0 | 0 | 0 | 0.52 |
| BWXT NEC | Frequency rate | 0 | 0 | 0 | 0 | 0.26 |
| BWXT Medical | LTI | N/A | N/A | N/A | N/A | 1 |
| BWXT Medical | Severity rate | N/A | N/A | N/A | N/A | 1.17 |
| BWXT Medical | Frequency rate | N/A | N/A | N/A | N/A | 0.39 |
| SRBT | LTI | 3 | 0 | 0 | 0 | 0 |
| SRBT | Severity rate | 17.7 | 0 | 0 | 0 | 0 |
| SRBT | Frequency rate | 7.6 | 0 | 0 | 0 | 0 |
| Nordion | LTI | 1 | 0 | 2 | 0 | 0 |
| Nordion | Severity rate | 5.61 | 0 | 4.15 | 0 | 0 |
| Nordion | Frequency rate | 0.93 | 0 | 0.69 | 0 | 0 |
| BTL | LTI | 1 | 2 | 2 | 0 | 0 |
| BTL | Severity rate | 15.00 | 8.21 | 5.47 | 0 | 0 |
| BTL | Frequency rate | 2.05 | 0.68 | 1.37 | 1.37 | 0 |
9 An LTI is an injury that takes place at work and results in the worker being unable to return to work for a period of time.
10 The accident severity rate measures the total number of days lost to injury for every 200,000 person-hours worked at the site. Severity = [(# of days lost in last 12 months) / (# of hours worked in last 12 months)] x 200,000.
11The accident frequency rate measures the number of LTIs for every 200,000 person-hours worked at the site. Frequency = [(# of injuries in last 12 months) / (# of hours worked in last 12 months)] x 200,000. Â Â Â Â Â Â
L. Reportable event
| Facility | Number of events |
|---|---|
| BRR | 2 |
| PHCF | 6 |
| CFM | 0 |
| BWXT NEC Toronto | 1 |
| BWXT NEC Peterborough | 1 |
| SRBT | 2 |
| Nordion | 7 |
| BTL | 1 |
| BWXT Medical | 2 |
| TOTAL | 22 |
M. Indigenous Nations, communities and organizations whose traditional and/or treaty territories are in proximity to the UNSPFs covered in the 2021 ROR
Blind River area (BRR facility)
- Mississauga First Nation
- Sagamok Anishnawbek Nation
- Serpent River First Nation
- Thessalon First Nation
- Métis Nation of Ontario (Region 4)
Port Hope, Toronto and Peterborough areas (PHCF, CFM, and BWXT NEC Toronto and Peterborough)
- Williams Treaties First Nations:
- Alderville First Nation
- Curve Lake First Nation
- Hiawatha First Nation
- Mississaugas of Scugog Island First Nation
- Chippewas of Beausoleil First Nation
- Chippewas of Georgina Island First Nation
- Chippewas of Rama First Nation
- Mississaugas of the Credit First Nation
- Métis Nation of Ontario (Regions 6 and 8)
- Mohawks of the Bay of Quinte
Ottawa Valley (SRBT, BWXT Medical, Nordion, and BTL)
- Algonquin Anishinabeg Nation Tribal Council
- Algonquin Nation Secretariat
- Algonquins of Barriere Lake
- Algonquins of Ontario
- Algonquins of Pikwà kanagà n First Nation
- Conseil de la Première Nation Abitibiwinni
- Kebaowek First Nation
- Kitcisakik First Nation
- Kitigan Zibi Anishinabeg
- Conseil de la Nation Anishnabe de Lac Simon
- Long Point First Nation
- Métis Nation of Ontario (Regions 5 and 6)
- Mohawks of the Bay of Quinte
- Timiskaming First Nation
- Wahgoshig First Nation
- Wolf Lake First Nation
N. Participant funding recipients for the 2021 UNSPF regulatory oversight report
| Recipients |
|---|
| Algonquins of Pikwakanagan First Nation |
| Curve Lake First Nation |
| Kebaowek First Nation |
| Nuclear Transparency Project |
Further information on the CNSC’s participant funding program can be found on the CNSC website.
Page details
- Date modified: