
Radiation doses
What is a radiation dose?
When ionizing radiation penetrates the human body or an object, it deposits energy. The energy absorbed from exposure to radiation is called a dose. Radiation dose quantities are described in three ways: absorbed, equivalent, and effective.
Absorbed dose
The energy absorbed in the human body from exposure to radiation is called an absorbed dose. The absorbed dose is measured in a unit called the gray (Gy). A dose of 1 gray is equivalent to 1 joule of energy deposited in a kilogram of a substance.
Equivalent dose
When radiation is absorbed in living matter, a biological effect may be observed. However, equal absorbed doses will not necessarily produce equal biological effects. The effect depends on the type of radiation (such as alpha, beta, gamma). For example, 1 Gy of alpha radiation is more harmful to a given tissue than 1 Gy of beta radiation. To obtain the equivalent dose, the absorbed dose is multiplied by a specified radiation weighting factor (wR) to reflect the relative biological effects of the different types of radiation. The equivalent dose is expressed in a measure called the sievert (Sv). This means that 1 Sv of alpha radiation will have the same biological effect as 1 Sv of beta radiation. In other words, the equivalent dose is expressed as a single unit that accounts for the degree of harm that different types of radiation would cause to the same tissue.
Effective dose
Different tissues and organs have different radiation sensitivities (see Figure 13). For example, bone marrow is much more radiosensitive than muscle or nerve tissue. To obtain an indication of how exposure can affect overall health, the equivalent dose is multiplied by a tissue weighting factor (wT) related to the risk for a particular tissue or organ. The result is the effective dose absorbed by the body. The unit used for effective dose is also the sievert.
Dose from background radiation
Radiation has always been present all around us. In fact, life has evolved in a world containing significant levels of ionizing radiation. It comes from space, the ground, and even within our own bodies. The doses due to natural background radiation vary depending on location and habits.
Dose from cosmic radiation
Regions at higher altitudes receive more cosmic radiation . According to a study by Health Canada, the annual effective dose of radiation from cosmic rays in Vancouver, British Columbia, which is at sea level, is about 0.30 mSv. This compares to the top of Mount Lorne, Yukon, where at 2,000 m, a person would receive an annual dose of about 0.84 mSv. Air travel also increases exposure to more cosmic radiation, for a further average dose of 0.01 mSv per Canadian per year.
Dose from terrestrial radiation
There are also natural sources of radiation in the ground. For example, some regions receive more terrestrial radiation from soils that are enriched with uranium. The average effective dose from the radiation emitted from the soil (and the construction materials that come from the ground) is approximately 0.5 mSv a year. However, the dose varies depending on location and geology, with doses reaching as high as 260 mSv in Northern Iran or 90 mSv in Nigeria. In Canada, the estimated highest annual dose for terrestrial radiation is approximately 1.4 mSv measured in the Northwest Territories.
Dose from inhalation
The earth’s crust also contributes to our levels of exposure. Radon gas, which is produced by the earth, is present in the air we breathe. Radon gas naturally disperses as it enters the atmosphere from the ground. However, when radon gas enters a building (through the floor from the ground), a concentration of it tends to build up. Long-term exposure to elevated levels of radon increases the risk of developing lung cancer. The worldwide average annual effective dose of radon radiation is approximately 1.2 mSv. Learn more about radon in your home.
Dose from ingestion
A number of sources of natural radiation that penetrate our bodies through the food we eat, the air we breathe and the water we drink. Potassium-40 is the main source of internal irradiation (aside from radon decay) found in a variety of everyday foods. The average effective dose from these sources is approximately 0.3 mSv a year.
| Canadian City | Total (mSv/y) | Cosmic radiation (mSv/y) | Terrestrial background (mSv/y) | Annual inhalation dose (mSv/y) | Radionuclides in the body (mSv/y) |
|---|---|---|---|---|---|
| CANADA | 1.8 | 0.3 | 0.2 | 0.9 | 0.3 |
| Whitehorse | 1.9 | 0.5 | 0.2 | 0.9 | 0.3 |
| Yellowknife | 3.1 | 0.4 | 1.4 | 0.9 | 0.3 |
| Victoria | 1.8 | 0.5 | 0.1 | 0.9 | 0.3 |
| Vancouver | 1.3 | 0.5 | 0.1 | 0.4 | 0.3 |
| Edmonton | 2.4 | 0.5 | 0.3 | 1.3 | 0.3 |
| Regina | 3.5 | 0.4 | 0.3 | 2.4 | 0.3 |
| Winnipeg | 4.1 | 0.4 | 0.2 | 3.2 | 0.3 |
| Toronto | 1.6 | 0.4 | 0.2 | 0.8 | 0.3 |
| Ottawa | 1.8 | 0.4 | 0.2 | 0.9 | 0.3 |
| Iqualuit | 1.9 | 0.5 | 0.2 | 0.9 | 0.3 |
| Québec City | 1.6 | 0.4 | 0.2 | 0.7 | 0.3 |
| Montreal | 1.6 | 0.4 | 0.3 | 0.7 | 0.3 |
| Fredericton | 1.8 | 0.3 | 0.3 | 0.9 | 0.3 |
| Halifax | 2.5 | 0.3 | 0.3 | 1.5 | 0.3 |
| Charlottetown | 1.8 | 0.3 | 0.2 | 0.9 | 0.3 |
| St-John's | 1.6 | 0.4 | 0.2 | 0.7 | 0.3 |
| Sources: Grasty et al., 2004, UNSCEAR 2008, Geological Survey of Canada | |||||
Worldwide dose levels from natural background radiation
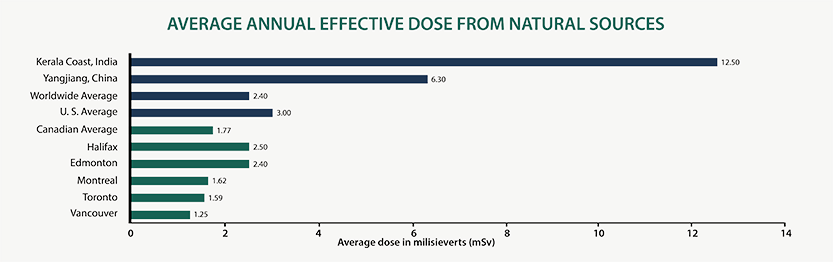
The total worldwide average effective dose from natural radiation is approximately 2.4 mSv a year. However, doses can vary greatly. The following figure shows how Canadian cities and the Canadian average dose compare to other parts of the world.
Text version
This image shows a graph displaying international and Canadian cities and their average annual effective dose from natural sources in millisieverts (mSv). (Kerala Coast, India: 12.50 mSv; Yangjiang, China: 6.30 mSv; Worldwide Average: 2.40 mSv; U.S. Average: 3.00 mSv; Canadian Average: 1.77; Halifax: 2.50 mSv; Edmonton: 2.40 mSv; Montreal: 1.62 mSv; Toronto: 1.59 mSv; Vancouver: 1.25 mSv).
Dose from artificial sources of radiation
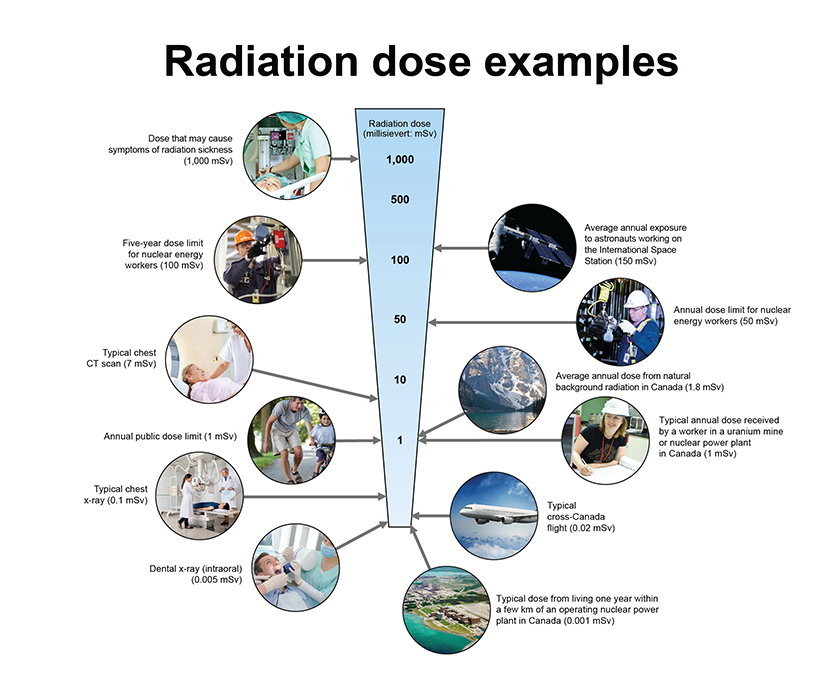
Artificial sources of radiation (commercial and industrial activities) account for approximately 0.6 mSv of our annual radiation exposure. X-rays and other diagnostic and therapeutic medical procedures account for approximately 1.2 mSv a year (UNSCEAR 2000). Consumer products like tobacco and smoke detectors account for another 0.1 mSv of our exposure to radiation each year.
Text version
Figure showing examples of typical doses received and dose limits for workers and the public ranging from 0.001 mSv to 1,000 mSv. The typical annual dose from living within a few kilometers of a nuclear power plant is 0.001 mSv. An intraoral dental x-ray is 0.005 mSv. A typical cross-Canada flight is 0.02 mSv. A typical chest x-ray is 0.1 mSv. The annual public dose limit is 1 mSv. A typical annual dose received by a worker in a uranium mine or nuclear power plant in Canada is around 1 mSv. The average annual dose from natural background radiation in Canada is 1.8 mSv. A typical chest CT scan is 7 mSv. The annual dose limit for nuclear energy workers is 50 mSv. The five-year dose limit for nuclear energy workers is 100 mSv. The average annual exposure to astronauts working on the International Space Station is 150 mSv. A dose that may cause symptoms of radiation sickness is around 1000 mSv.
In all, natural radiation accounts for approximately 60% of our annual dose. Medical procedures account for roughly 40% of our annual dose.
There is no difference between the effects caused by natural or man-made radiation.
| Study Type | Relevant Organ | Dose (mSv) |
|---|---|---|
| Dental x-ray | Brain | 0.01 table 2 note 1 |
| Chest x-ray | Lung | 0.1 table 2 note 1 |
| Screening mammography | Breast | 3 table 2 note 2 |
| Adult abdominal CT | Stomach | 10 table 2 note 2 |
| Neonatal abdominal CT | Stomach | 20 table 2 note 2 |
Table 2 Notes
|
||
Dose limits
The Canadian Radiation Protection Regulations set limits on the amount of radiation the public and nuclear energy workers may receive.

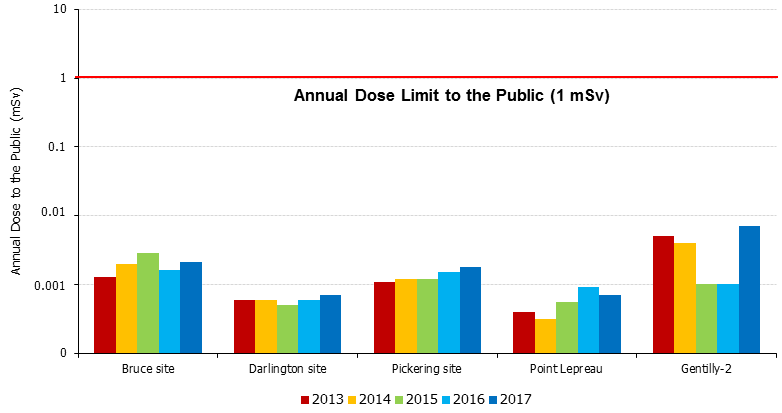
In Canada, the effective dose limits for the public is 1 mSv in one calendar year. Regular reporting and monitoring demonstrates the average annual effective doses to the public from activities licensed by the CNSC range from 0.001 to 0.1 mSv per year.
Text version
Figure showing a bar graph with annual dose to the public in mSv for nuclear power plant sites including Bruce site, Darlington site, Pickering site, Point Lepreau, and Gentily-2. Annual doses are for 2013-2017 and indicate that the dose to the public is well below the annual dose limit for members of the public of 1 mSv.
The effective dose limits for a nuclear energy worker is set at 50 mSv in any one year and 100 mSv in five consecutive years. The dose limit for pregnant workers is 4 mSv from the time the pregnancy is declared to the end of the term. In addition, licensees must ensure that all doses are as low as reasonably achievable, social and economic factors being taken into account ( ALARA ). Regular reporting and monitoring demonstrate the average annual doses to the most exposed workers (e.g., industrial radiographer) are approximately 5 mSv per year.
How radiation dose limits are set
Canadian regulations follow the recommendations of the International Commission on Radiological Protection, which comprises some of the world's leading scientists and other professionals in the field of radiation protection, and also uses many of the standards and guides of the International Atomic Energy Agency.
In Canada, the regulations, standards and practices to protect people and workers from radiation that are not governed by the CNSC are implemented by Health Canada, Employment and Social Development Canada, the Department of National Defence and the provincial/territorial governments.
In addition, the Federal-Provincial-Territorial Radiation Protection Committee (FPtrPC) develops guidelines with respect to ionizing and non-ionizing radiation and works to harmonize radiation protection regulations across Canada. Co-chaired by the CNSC, Health Canada and the provinces, the FPtrPC provides a national forum on radiation protection issues.
Radioactive releases to doses: Going from becquerels to millisieverts
Nuclear facilities release very small amounts of radioactivity to the environment during normal operation. These releases are minute, are monitored and controlled by the facility operator, and are reported to the CNSC. The radioactivity of these releases is measured in a unit called becquerels (Bq). The amount of radiation absorbed into one’s body is called a dose, measured in millisieverts (mSv). A dose is calculated using a model that considers how radioactive releases move through the environment (for example, soil, water, vegetation, food and air) and are taken up by a person resulting in an exposure. The model identifies all possible exposure pathways, such as through ingestion or inhalation. The input to the model is radioactivity (Bq) and the output is the dose to a person (mSv).
Related links
Page details
- Date modified: